

Dendro is Optilogic's simulation-optimization engine. A prime use case for Dendro is inventory policy optimization.
Simulation-optimization is a method in which simulation is leveraged to intelligently explore alternative configurations of a system. Dendro accomplishes this data-driven search by layering a genetic algorithm on top of simulation; simulation is the core of a Dendro model. Before a Dendro study can begin, a simulation model (run with the Throg engine) must be built, verified, and validated.
Simulation-optimization enables us to ask and answer questions that we cannot address in traditional network optimization or simulation alone.
In this article, we will explore:
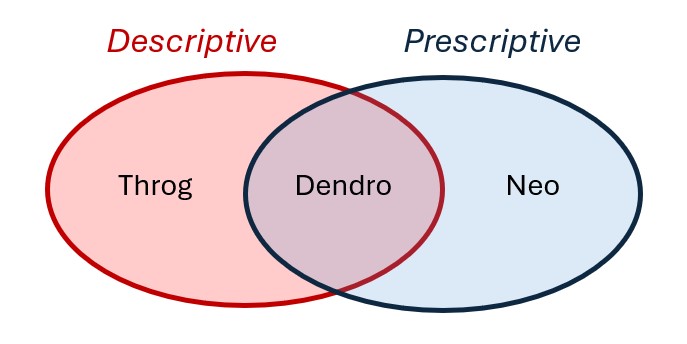
The modeling methods of network optimization (Neo), discrete event simulation (Throg), and simulation-optimization (Dendro) address different supply chain design use cases.
A prime use case for Dendro is inventory policy optimization: right-sizing inventory levels by changing inventory policy parameters (reorder points, reorder quantities, etc.) with the goal of balancing cost and service. Dendro's foundation in simulation minimizes the abstraction of cost accounting, service metrics, and the business rules surrounding inventory management. Dendro provides actionable inventory policy recommendations and data-driven evidence to support those changes.
Primary Focus: Determining where inventory should be positioned across the network.
Use Case: Network design decisions that include high-level inventory considerations -- such as stocking locations, target turns, and working capital trade-offs.
How It Handles Inventory:
Primary Focus: Testing and observing how specific inventory policies perform under realistic operational dynamics.
Use Case: Evaluate inventory control logic (e.g., reorder point, order quantity, order-up-to level) in a time-based simulation environment.
How It Handles Inventory:
Primary Focus: Finding better inventory policies that balance cost and service, combining Throg's simulation accuracy with an optimization engine.
Use Case: Adjust inventory policy parameters (e.g., reorder point, reorder quantity, policy type) to find configurations that deliver the best cost-service trade-offs.
How It Handles Inventory:
While this comparison highlights how each engine contributes to inventory management decisions, the specific use case covered in this article is inventory policy optimization -- using Dendro to balance total inventory carrying cost and network-level customer service (measured as quantity fill rate).
That said, Dendro's capabilities extend far beyond inventory. The same framework of input factors, output factors, and utility functions can be applied to a wide range of optimization problems -- and its utility components are not limited to just cost and service. Dendro can optimize for any measurable performance metric that matters to your business.
As stated above, a Dendro study cannot be initiated without first establishing a Throg simulation model; a Dendro project should be thought of as a simulation project with an added layer of analysis. Careful Throg model verification and validation are part of a simulation project and are therefore a prerequisite for a Dendro study. To learn how to set up a Throg simulation model, we recommend reviewing the following on-demand training content:
In addition, Throg-specific articles can be found here on the Help Center.
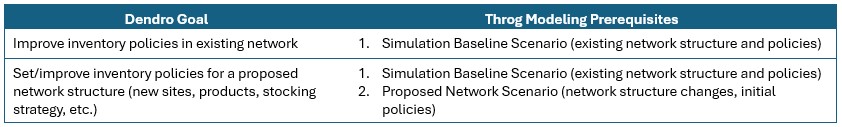
Throg scenario results serve as one piece of input for a Dendro run. Identification of the appropriate Throg scenario to apply Dendro to depends on the goal of the Dendro study. The network structure under which the modeler is seeking to optimize inventory policies must be represented in a Throg scenario.
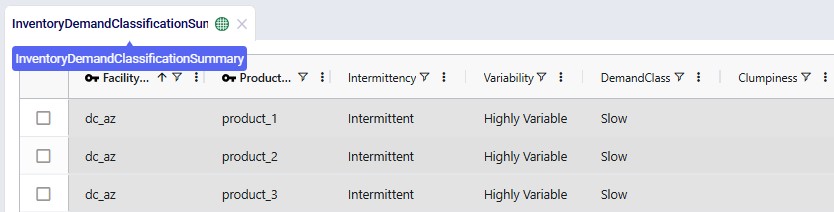
Inventory policies are required to run a simulation scenario. In some cases, a modeler may not have existing inventory policies to utilize in a baseline scenario. Similarly, simulating a proposed network structure requires first setting inventory policies for new site-product combinations. To set policies, we recommend utilizing the Demand Classification utility in Cosmic Frog's Utilities module.

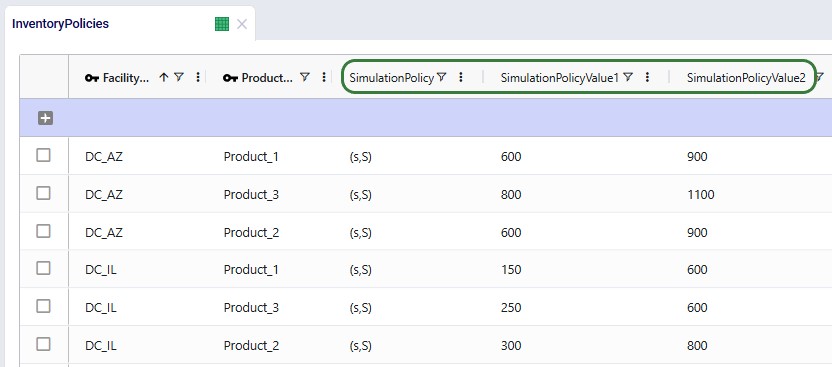
Suggested inventory policies from the Inventory Policy Data Summary output table can then be employed in the Inventory Policies input table. For the sake of testing while the Throg model is being built and verified, users may find it helpful to initially leverage simple placeholder inventory policies where policies are unknown or not yet in existence (e.g., (s,S) = (0,0)).
Note: if the modeler's goal is to set policies for a proposed network structure, it is recommended to first optimize Baseline inventory policies. This enables the modeler to compare potential performance of the existing network structure (i.e., performance under optimized policies) with performance of the proposed network structure. This is especially encouraged if the Demand Classification utility was used to set Baseline inventory policies.
Before running Dendro to optimize inventory policies, the modeler must consider
The answers to these questions will inform the design of Dendro model inputs.
Every Dendro optimization begins with a well-defined model foundation and input configuration.
This configuration tells Dendro three essential things:
Together, these define the search space and fitness criteria that drive optimization.
Dendro builds directly on your validated Throg simulation model, which serves as the environment for its optimization runs.
All Throg input tables -- facilities, customers, products, and policies -- are carried into Dendro.
For inventory-focused optimizations, the Inventory Policies input table is most critical.
It defines policy types and parameters such as reorder points and order-up-to levels. These become natural candidates for Dendro input factors.
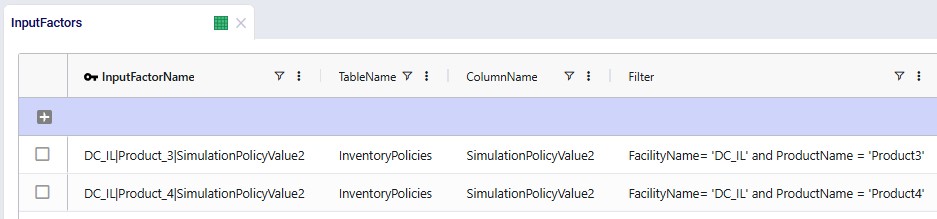
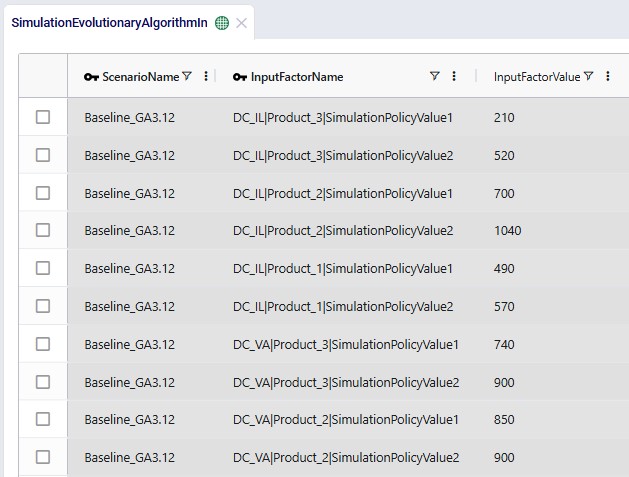
The Input Factors input table tells Dendro which parameters it can adjust during optimization. Each input factor represents a decision lever -- for instance, a reorder point or a policy type -- that Dendro will tune to seek better outcomes.
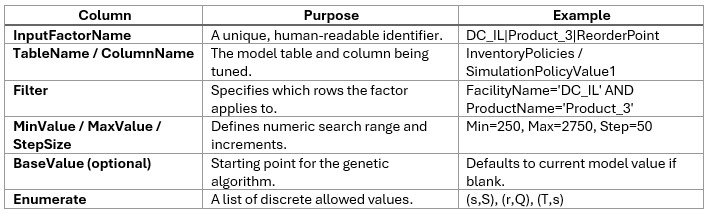
The search space defines both the breadth (how wide Dendro can explore) and the granularity (how detailed the exploration is).
The goal is a "computationally tractable search space" -- broad enough for Dendro to discover impactful alternatives but focused enough to identify patterns efficiently.

Learn all about input factors in the "Dendro: Input Factors Guide".
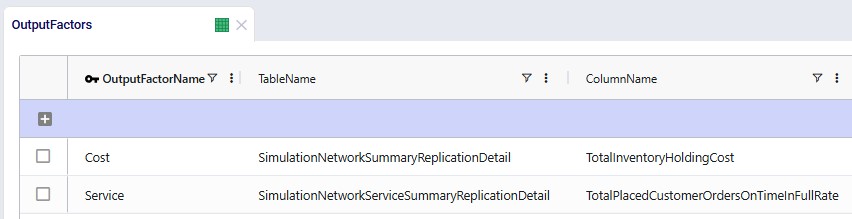
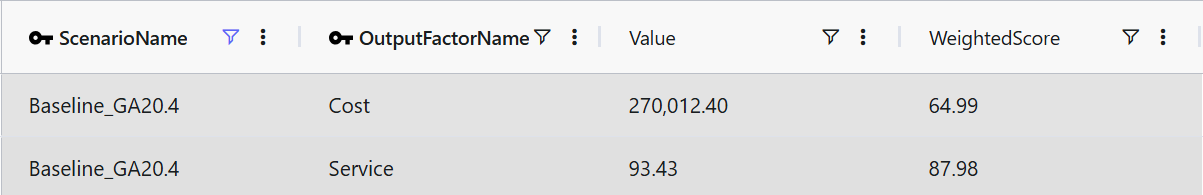
Once Dendro knows what it can vary, it needs to know how to judge success. The Output Factors input table defines the KPIs Dendro will use to evaluate each scenario and how they are scored.
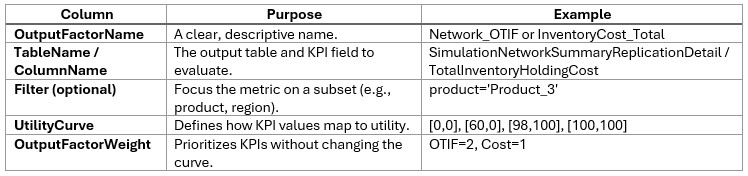
Utility curves express your business preferences:
Examples:
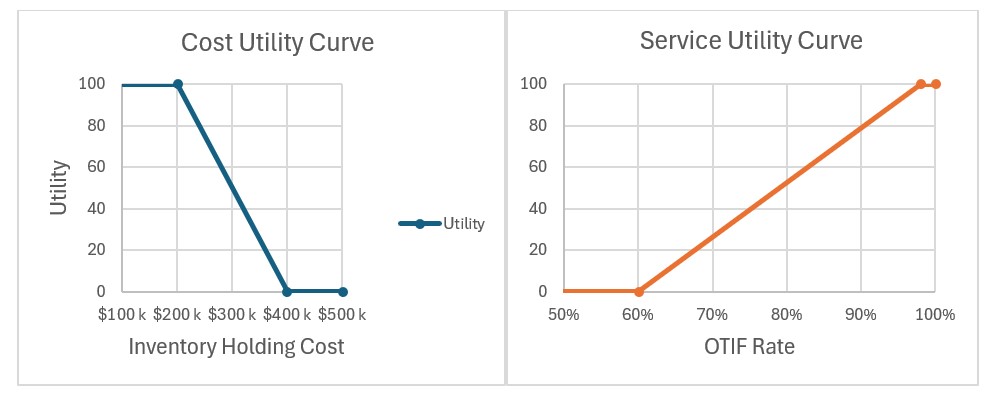
Tip: Curves should span the expected simulation range (e.g., 5th-95th percentile of early results). Dendro will stretch the utility curves if results fall outside the range, which can distort scoring.
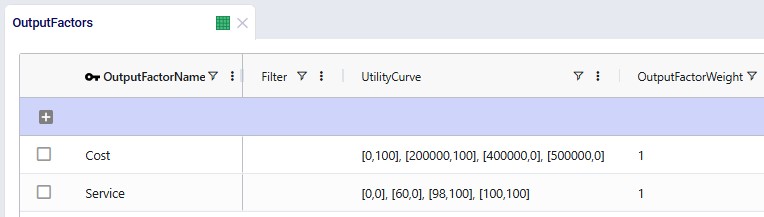
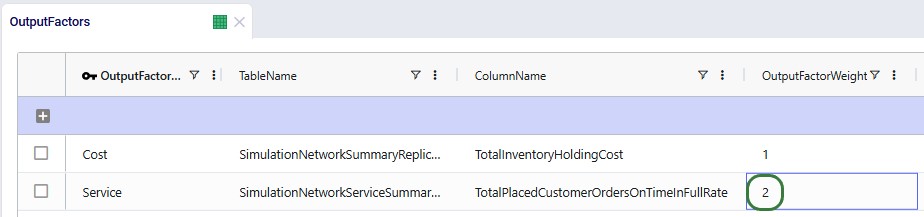
Weights dictate how much influence each KPI has in Dendro's overall fitness score calculation.
Learn more about output factors in the "Dendro: Output Factors Guide".
A well-scoped input configuration defines the playing field for Dendro's optimization.
By combining realistic input ranges, balanced KPI scoring, and robust run settings, you enable Dendro to explore intelligently finding high-performing, data-backed configurations without unnecessary computation.
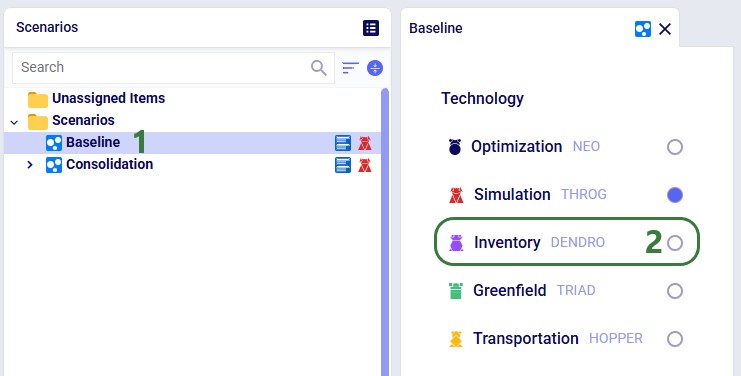
Dendro is built to explore a wide range of supply chain configurations using your verified and validated Throg simulation scenario(s) as the base. Running a Dendro job is straightforward, but there are a few important steps and best practices to keep in mind to ensure smooth operation.
To get started:
INSERT INTO anura_2_8.modelrunoptions (
  datatype,
  description,
  option,
  status,
  technology,
  uidisplaycategory,
  uidisplayname,
  uidisplayorder,
  uidisplaysubcategory,
  value)
VALUES (
  'double',
  'Time limit (seconds) on individual Dendro scenarios',
  'DendroTimeout',
  'Include',
  '[DENDRO]',
  'Basic',
  'Dendro Timeout',
  '',
  '',
  '3600');
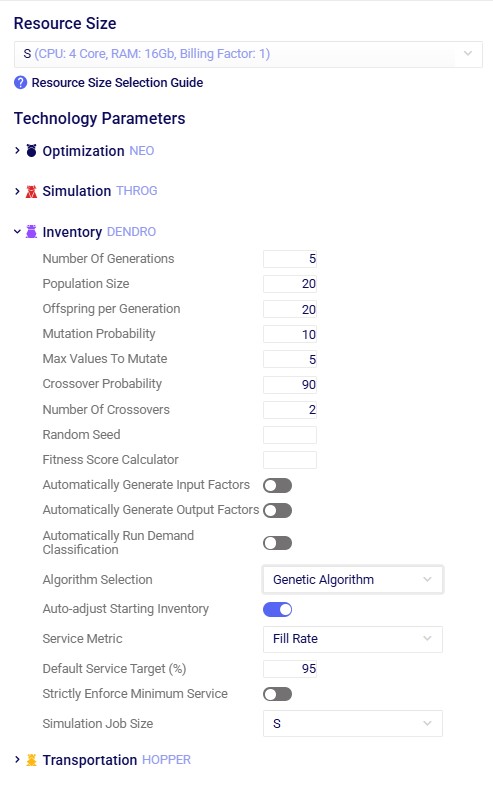
The technology parameters define how Dendro explores the solution space -- including how many scenarios to generate, how they evolve, and how long each simulation may run. As mentioned above, the default values are typically sufficient for a first run. The following are the main parameters that users may want to update in case their defaults are not suitable.
Key Settings
See also more detailed explanations of all Dendro technology parameters here.
Tuning Guidance
Use these principles to fine-tune your technology parameters:
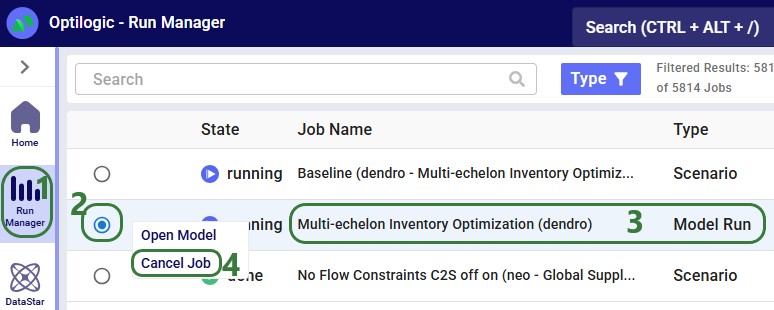
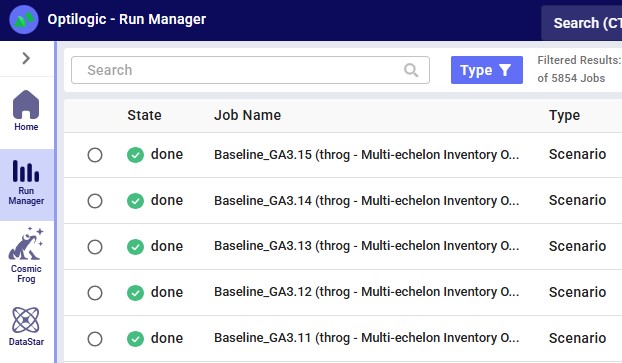
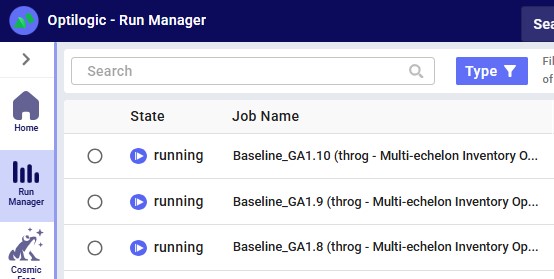
In the course of a Dendro run, the system launches many scenarios for each generation. This is the expected behavior for the genetic algorithm.
Key tips for tracking progress:
Running Dendro is as simple as selecting the engine and starting from a validated Throg model. From there, you can monitor progress, let the algorithm evolve scenarios, and apply best practices for canceling or troubleshooting runs. By following these guidelines, you ensure that Dendro can efficiently search for high-performing supply chain configurations.
To understand how the Dendro genetic algorithm works in detail, please see "Dendro: Genetic Algorithm Guide".
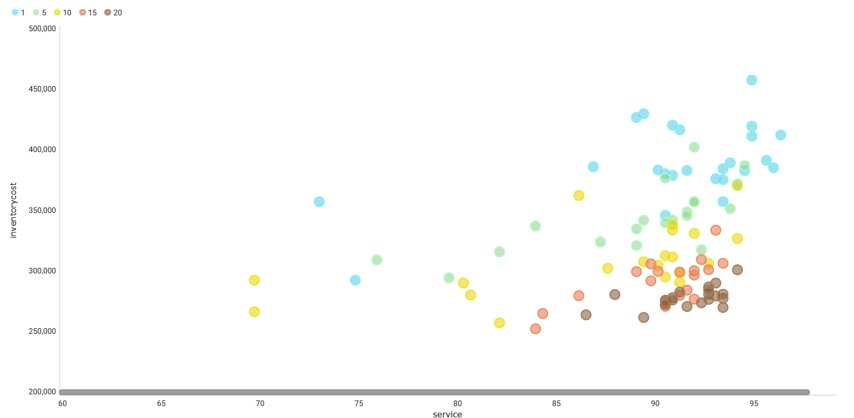
When a Dendro run completes, it produces a rich set of outputs that capture the results of the genetic algorithm's search. These outputs represent the different supply chain configurations that were explored, along with how each one performed according to the objectives you defined (e.g., cost, service level, or a balance of both).
Rather than giving you a single "right" answer, Dendro presents a spectrum of high-performing options. As the modeler, you use these results to evaluate trade-offs and select the scenarios that best align with your business goals.
During a run, Dendro evaluates each candidate scenario by:
Dendro records the input factors and output factors of every scenario it evaluates. However, only the top 20 highest-performing scenarios are saved as named scenarios in your model, making them easier to access and reuse.
After the run, the top 20 scenarios are automatically saved in your model. These represent the best balances of trade-offs Dendro discovered within your defined search space.
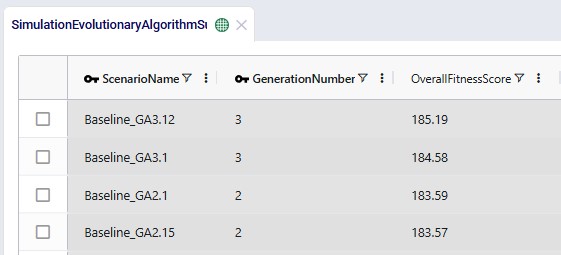
Each scenario has an overall fitness score, calculated as the weighted sum of its output factor utility values. A higher score means the scenario performed well according to the priorities you set (e.g., balancing low cost with high service).
Tip: The "best" scenario numerically may not always be the most practical operationally. Always interpret results in context.
Where to Find Key Results
Tips for Reviewing Results
Dendro generates raw scenario outputs, but actionable recommendations come from your interpretation in the context of business goals.
In summary, Dendro does not hand you a single answer, it gives you a portfolio of high-performing options. By interpreting these scenarios in context, you can make informed decisions, balance trade-offs, and run deeper simulations where needed to guide your supply chain strategy.
You may find these links helpful, some of which have already been mentioned above:
As always, please feel free to reach out to the Optilogic Support team at support@optilogic.com in case of questions or feedback.

Dendro is Optilogic's simulation-optimization engine. A prime use case for Dendro is inventory policy optimization.
Simulation-optimization is a method in which simulation is leveraged to intelligently explore alternative configurations of a system. Dendro accomplishes this data-driven search by layering a genetic algorithm on top of simulation; simulation is the core of a Dendro model. Before a Dendro study can begin, a simulation model (run with the Throg engine) must be built, verified, and validated.
Simulation-optimization enables us to ask and answer questions that we cannot address in traditional network optimization or simulation alone.
In this article, we will explore:
The modeling methods of network optimization (Neo), discrete event simulation (Throg), and simulation-optimization (Dendro) address different supply chain design use cases.
A prime use case for Dendro is inventory policy optimization: right-sizing inventory levels by changing inventory policy parameters (reorder points, reorder quantities, etc.) with the goal of balancing cost and service. Dendro's foundation in simulation minimizes the abstraction of cost accounting, service metrics, and the business rules surrounding inventory management. Dendro provides actionable inventory policy recommendations and data-driven evidence to support those changes.
Primary Focus: Determining where inventory should be positioned across the network.
Use Case: Network design decisions that include high-level inventory considerations -- such as stocking locations, target turns, and working capital trade-offs.
How It Handles Inventory:
Primary Focus: Testing and observing how specific inventory policies perform under realistic operational dynamics.
Use Case: Evaluate inventory control logic (e.g., reorder point, order quantity, order-up-to level) in a time-based simulation environment.
How It Handles Inventory:
Primary Focus: Finding better inventory policies that balance cost and service, combining Throg's simulation accuracy with an optimization engine.
Use Case: Adjust inventory policy parameters (e.g., reorder point, reorder quantity, policy type) to find configurations that deliver the best cost-service trade-offs.
How It Handles Inventory:
While this comparison highlights how each engine contributes to inventory management decisions, the specific use case covered in this article is inventory policy optimization -- using Dendro to balance total inventory carrying cost and network-level customer service (measured as quantity fill rate).
That said, Dendro's capabilities extend far beyond inventory. The same framework of input factors, output factors, and utility functions can be applied to a wide range of optimization problems -- and its utility components are not limited to just cost and service. Dendro can optimize for any measurable performance metric that matters to your business.
As stated above, a Dendro study cannot be initiated without first establishing a Throg simulation model; a Dendro project should be thought of as a simulation project with an added layer of analysis. Careful Throg model verification and validation are part of a simulation project and are therefore a prerequisite for a Dendro study. To learn how to set up a Throg simulation model, we recommend reviewing the following on-demand training content:
In addition, Throg-specific articles can be found here on the Help Center.
Throg scenario results serve as one piece of input for a Dendro run. Identification of the appropriate Throg scenario to apply Dendro to depends on the goal of the Dendro study. The network structure under which the modeler is seeking to optimize inventory policies must be represented in a Throg scenario.
Inventory policies are required to run a simulation scenario. In some cases, a modeler may not have existing inventory policies to utilize in a baseline scenario. Similarly, simulating a proposed network structure requires first setting inventory policies for new site-product combinations. To set policies, we recommend utilizing the Demand Classification utility in Cosmic Frog's Utilities module.
Suggested inventory policies from the Inventory Policy Data Summary output table can then be employed in the Inventory Policies input table. For the sake of testing while the Throg model is being built and verified, users may find it helpful to initially leverage simple placeholder inventory policies where policies are unknown or not yet in existence (e.g., (s,S) = (0,0)).
Note: if the modeler's goal is to set policies for a proposed network structure, it is recommended to first optimize Baseline inventory policies. This enables the modeler to compare potential performance of the existing network structure (i.e., performance under optimized policies) with performance of the proposed network structure. This is especially encouraged if the Demand Classification utility was used to set Baseline inventory policies.
Before running Dendro to optimize inventory policies, the modeler must consider
The answers to these questions will inform the design of Dendro model inputs.
Every Dendro optimization begins with a well-defined model foundation and input configuration.
This configuration tells Dendro three essential things:
Together, these define the search space and fitness criteria that drive optimization.
Dendro builds directly on your validated Throg simulation model, which serves as the environment for its optimization runs.
All Throg input tables -- facilities, customers, products, and policies -- are carried into Dendro.
For inventory-focused optimizations, the Inventory Policies input table is most critical.
It defines policy types and parameters such as reorder points and order-up-to levels. These become natural candidates for Dendro input factors.
The Input Factors input table tells Dendro which parameters it can adjust during optimization. Each input factor represents a decision lever -- for instance, a reorder point or a policy type -- that Dendro will tune to seek better outcomes.
The search space defines both the breadth (how wide Dendro can explore) and the granularity (how detailed the exploration is).
The goal is a "computationally tractable search space" -- broad enough for Dendro to discover impactful alternatives but focused enough to identify patterns efficiently.
Learn all about input factors in the "Dendro: Input Factors Guide".
Once Dendro knows what it can vary, it needs to know how to judge success. The Output Factors input table defines the KPIs Dendro will use to evaluate each scenario and how they are scored.
Utility curves express your business preferences:
Examples:
Tip: Curves should span the expected simulation range (e.g., 5th-95th percentile of early results). Dendro will stretch the utility curves if results fall outside the range, which can distort scoring.
Weights dictate how much influence each KPI has in Dendro's overall fitness score calculation.
Learn more about output factors in the "Dendro: Output Factors Guide".
A well-scoped input configuration defines the playing field for Dendro's optimization.
By combining realistic input ranges, balanced KPI scoring, and robust run settings, you enable Dendro to explore intelligently finding high-performing, data-backed configurations without unnecessary computation.
Dendro is built to explore a wide range of supply chain configurations using your verified and validated Throg simulation scenario(s) as the base. Running a Dendro job is straightforward, but there are a few important steps and best practices to keep in mind to ensure smooth operation.
To get started:
INSERT INTO anura_2_8.modelrunoptions (
  datatype,
  description,
  option,
  status,
  technology,
  uidisplaycategory,
  uidisplayname,
  uidisplayorder,
  uidisplaysubcategory,
  value)
VALUES (
  'double',
  'Time limit (seconds) on individual Dendro scenarios',
  'DendroTimeout',
  'Include',
  '[DENDRO]',
  'Basic',
  'Dendro Timeout',
  '',
  '',
  '3600');
The technology parameters define how Dendro explores the solution space -- including how many scenarios to generate, how they evolve, and how long each simulation may run. As mentioned above, the default values are typically sufficient for a first run. The following are the main parameters that users may want to update in case their defaults are not suitable.
Key Settings
See also more detailed explanations of all Dendro technology parameters here.
Tuning Guidance
Use these principles to fine-tune your technology parameters:
In the course of a Dendro run, the system launches many scenarios for each generation. This is the expected behavior for the genetic algorithm.
Key tips for tracking progress:
Running Dendro is as simple as selecting the engine and starting from a validated Throg model. From there, you can monitor progress, let the algorithm evolve scenarios, and apply best practices for canceling or troubleshooting runs. By following these guidelines, you ensure that Dendro can efficiently search for high-performing supply chain configurations.
To understand how the Dendro genetic algorithm works in detail, please see "Dendro: Genetic Algorithm Guide".
When a Dendro run completes, it produces a rich set of outputs that capture the results of the genetic algorithm's search. These outputs represent the different supply chain configurations that were explored, along with how each one performed according to the objectives you defined (e.g., cost, service level, or a balance of both).
Rather than giving you a single "right" answer, Dendro presents a spectrum of high-performing options. As the modeler, you use these results to evaluate trade-offs and select the scenarios that best align with your business goals.
During a run, Dendro evaluates each candidate scenario by:
Dendro records the input factors and output factors of every scenario it evaluates. However, only the top 20 highest-performing scenarios are saved as named scenarios in your model, making them easier to access and reuse.
After the run, the top 20 scenarios are automatically saved in your model. These represent the best balances of trade-offs Dendro discovered within your defined search space.
Each scenario has an overall fitness score, calculated as the weighted sum of its output factor utility values. A higher score means the scenario performed well according to the priorities you set (e.g., balancing low cost with high service).
Tip: The "best" scenario numerically may not always be the most practical operationally. Always interpret results in context.
Where to Find Key Results
Tips for Reviewing Results
Dendro generates raw scenario outputs, but actionable recommendations come from your interpretation in the context of business goals.
In summary, Dendro does not hand you a single answer, it gives you a portfolio of high-performing options. By interpreting these scenarios in context, you can make informed decisions, balance trade-offs, and run deeper simulations where needed to guide your supply chain strategy.
You may find these links helpful, some of which have already been mentioned above:
As always, please feel free to reach out to the Optilogic Support team at support@optilogic.com in case of questions or feedback.


