

The Model Output Insights Agent helps users investigate and analyze Cosmic Frog model outputs by turning analytical questions into structured, data-backed strategic reports. It breaks down complex questions into a step-by-step exploration plan, executes targeted queries, synthesizes findings, and produces a professional report - complete with visualizations and actionable recommendations.
This documentation describes how this specific agent works and can be configured. Please see the “AI Agents: Architecture and Components” Help Center article if you are interested in understanding how the Optilogic AI Agents work at a detailed level.
Extracting meaningful insights from large databases typically requires exploring and analyzing many output tables which can take a lot of time and effort. The Model Output Insights Agent streamlines the process, helping users get to the insights quicker than ever before.
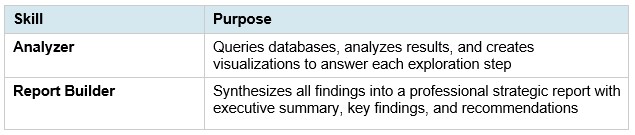
Main skills the Model Output Insights Agent uses:
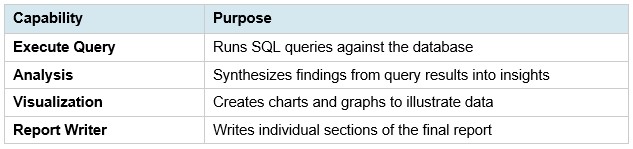
Supporting capabilities:
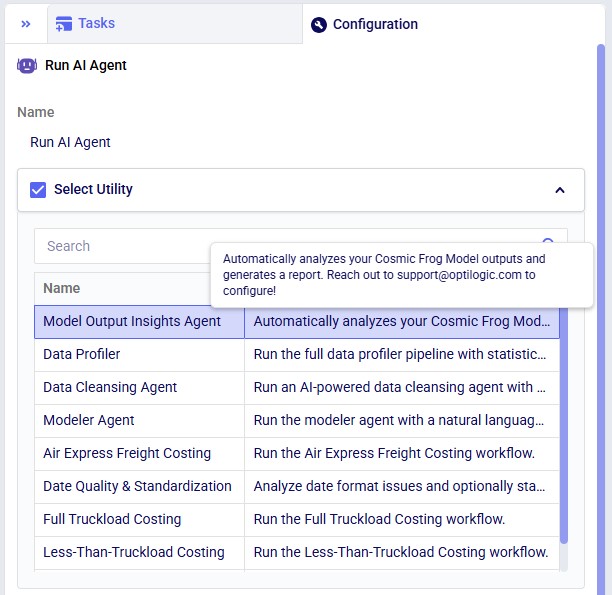
The agent can be accessed through the Run AI Agent task in DataStar. Once a Run AI Agent task is added to the macro, first the Model Output Insights Agent needs to be selected from the list of available agents and utilities in the "Select Utility" section:
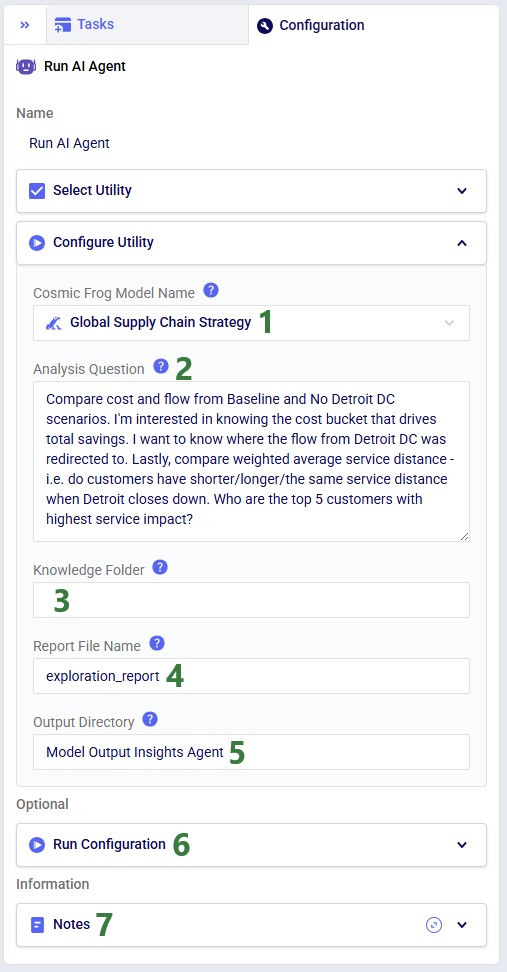
Next, the inputs and settings for the task can be specified in the Configure Utility, Run Configuration, and Notes sections:
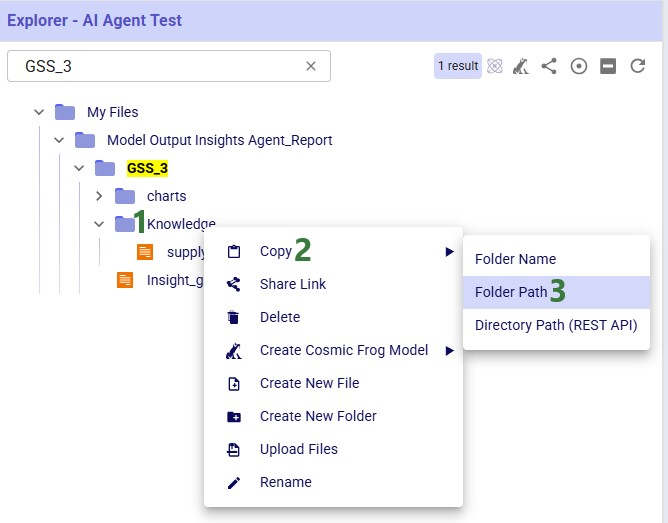
This next screenshot shows how to get a Folder Path while in the Explorer application: 1) right-click on the folder in the Explorer, 2) hover over Copy in the context menu, and 3) click on Folder Path:
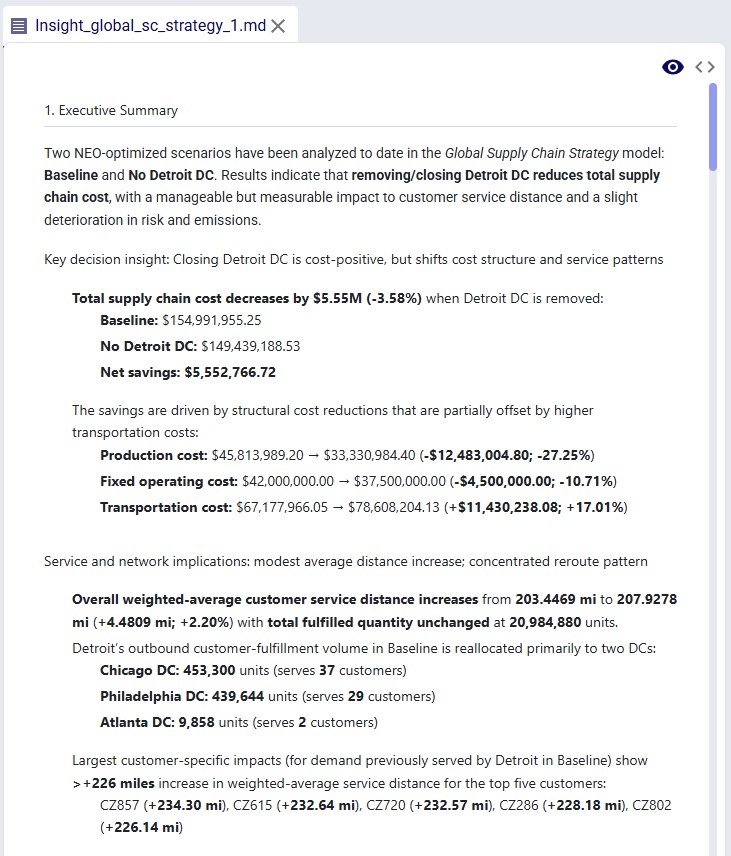
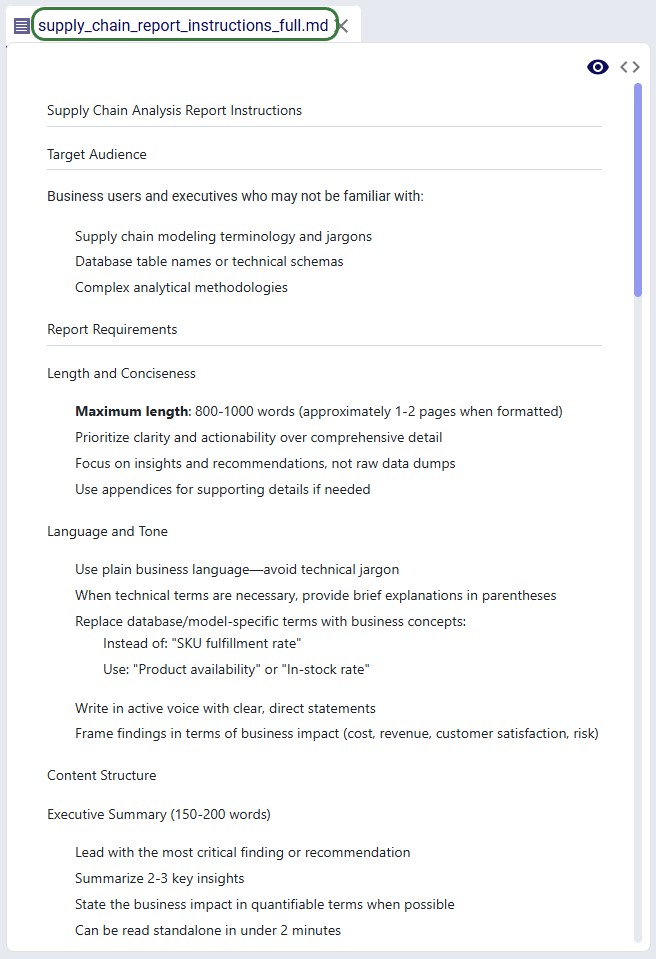
After the run, a report in both markdown (.md) and pdf (.pdf) format and charts (if any) are created and can be found in the Explorer with the specified file name and folder. Once clicked, the file is opened in the Lightning Editor application for review.
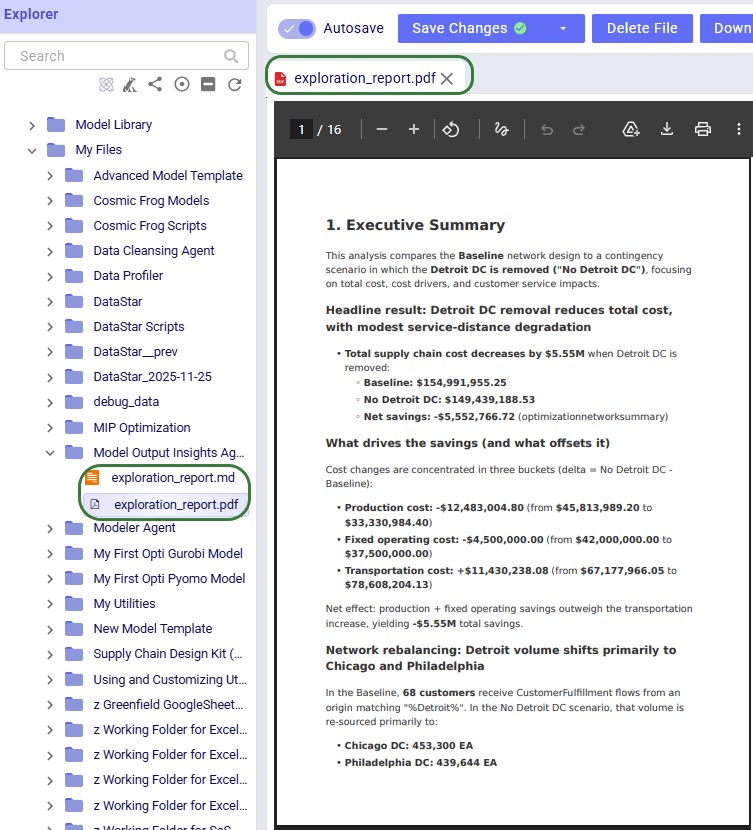
Note that currently the charts are only included in the markdown file as a file name. Users can look for the charts in the Charts folder in the targeted output directory.
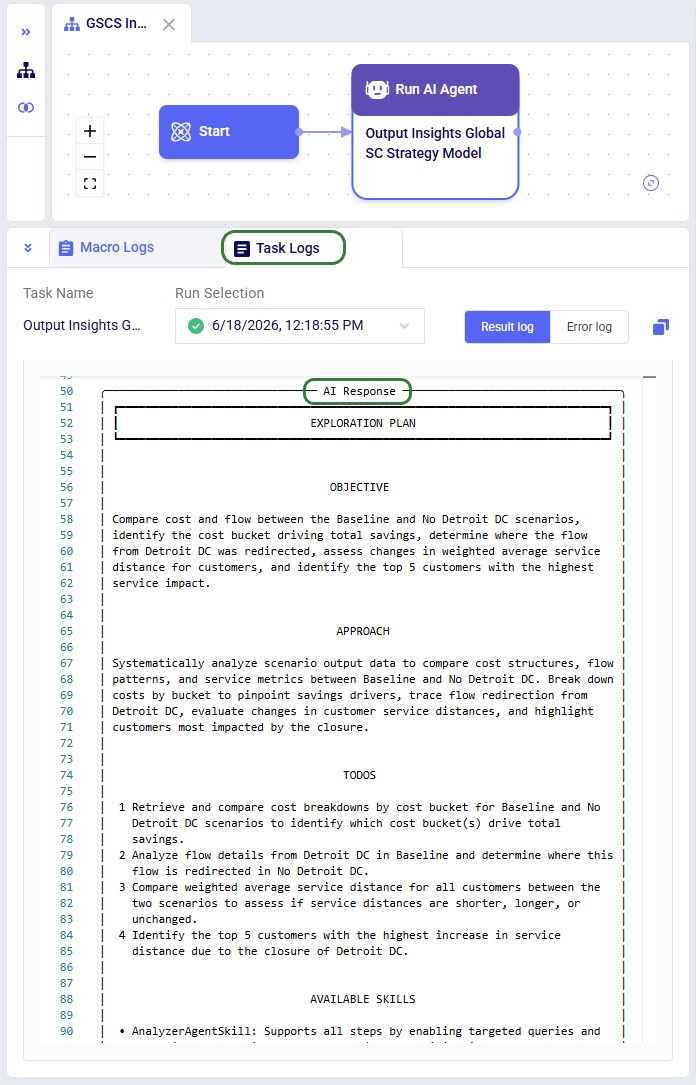

The Model Output Insights Agent helps users investigate and analyze Cosmic Frog model outputs by turning analytical questions into structured, data-backed strategic reports. It breaks down complex questions into a step-by-step exploration plan, executes targeted queries, synthesizes findings, and produces a professional report - complete with visualizations and actionable recommendations.
This documentation describes how this specific agent works and can be configured. Please see the “AI Agents: Architecture and Components” Help Center article if you are interested in understanding how the Optilogic AI Agents work at a detailed level.
Extracting meaningful insights from large databases typically requires exploring and analyzing many output tables which can take a lot of time and effort. The Model Output Insights Agent streamlines the process, helping users get to the insights quicker than ever before.
Main skills the Model Output Insights Agent uses:
Supporting capabilities:
The agent can be accessed through the Run AI Agent task in DataStar. Once a Run AI Agent task is added to the macro, first the Model Output Insights Agent needs to be selected from the list of available agents and utilities in the "Select Utility" section:
Next, the inputs and settings for the task can be specified in the Configure Utility, Run Configuration, and Notes sections:
This next screenshot shows how to get a Folder Path while in the Explorer application: 1) right-click on the folder in the Explorer, 2) hover over Copy in the context menu, and 3) click on Folder Path:
After the run, a report in both markdown (.md) and pdf (.pdf) format and charts (if any) are created and can be found in the Explorer with the specified file name and folder. Once clicked, the file is opened in the Lightning Editor application for review.
Note that currently the charts are only included in the markdown file as a file name. Users can look for the charts in the Charts folder in the targeted output directory.


