

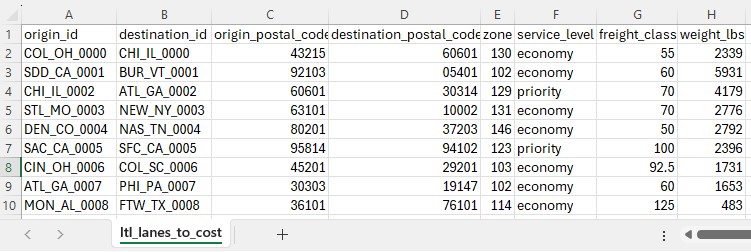
The Less Than Truckload Costing utility solves the challenge of pricing less-than-truckload (LTL) shipments when carrier rate data is complex and varies by service level, distance, and weight. Rather than manually looking up rates in carrier tariff tables, this workflow automates the entire process using FedEx Express Freight standard list rates. The utility expects a lanes-to-cost table containing shipment details including origin, destination, distance, weight, and desired service level. After running the utility, users receive a fully costed table with calculated transportation costs.
The Less Than Truckload Costing Utility is available on the Resource Library, from which you can download it or copy it to your Optilogic account. Learn more about the Resource Library in this How to use the Resource Library help center article.
Sample Data
System Utility
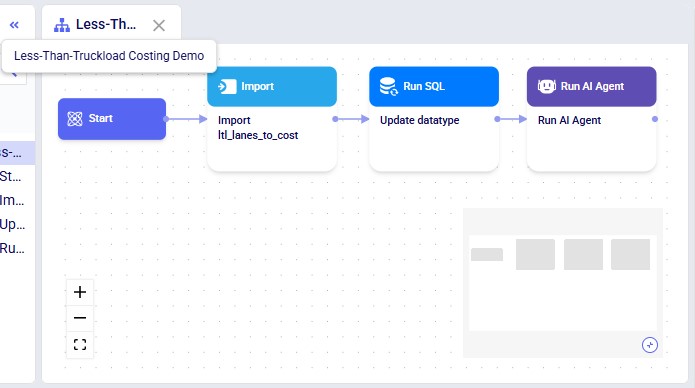
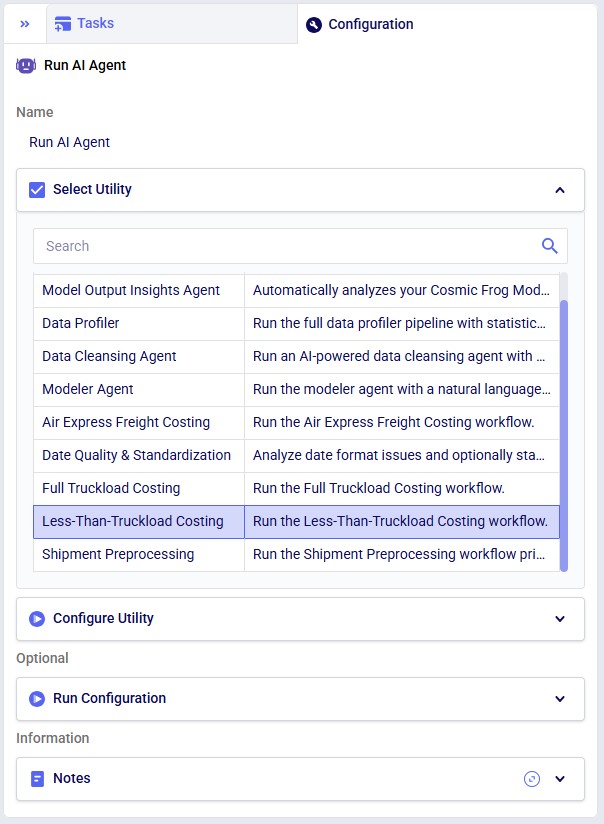
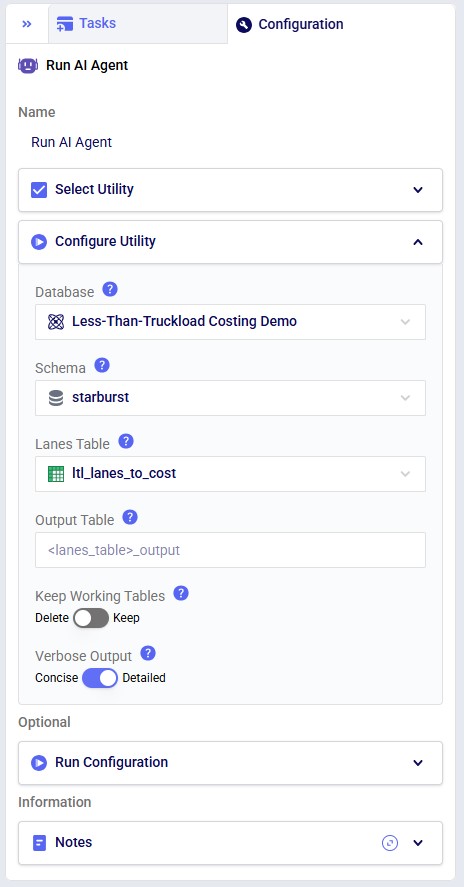
The steps to use this utility are as follows. These are illustrated with screenshots below.
Screenshots of the steps:
Key Constraints:
The utility produces an output table containing all lanes from the input with the following additional columns populated:
LTL costs are calculated as a three-component sum:
Each component is calculated independently using the formula:
Where:
FedEx Freight zones (101–150) represent the transit distance and pricing tier between an origin and destination. Zones are assigned by FedEx based on origin and destination ZIP codes. You can determine the correct zone for a lane using the FedEx Freight zone chart or a zone lookup tool.
Higher zone numbers generally correspond to longer distances and higher rates.
The utility supports the following standard NMFC freight classes:
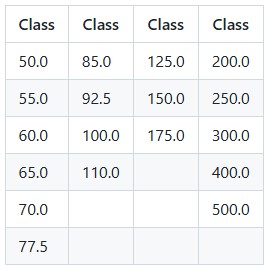
Freight class values are case-insensitive and will be normalized automatically. Common formats such as "60", "60.0", and "60.00" are all accepted and treated as equivalent.
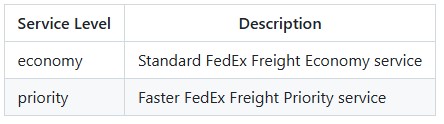
Service level values are normalized to lowercase automatically, so "Economy", "ECONOMY", and "economy" are all accepted.
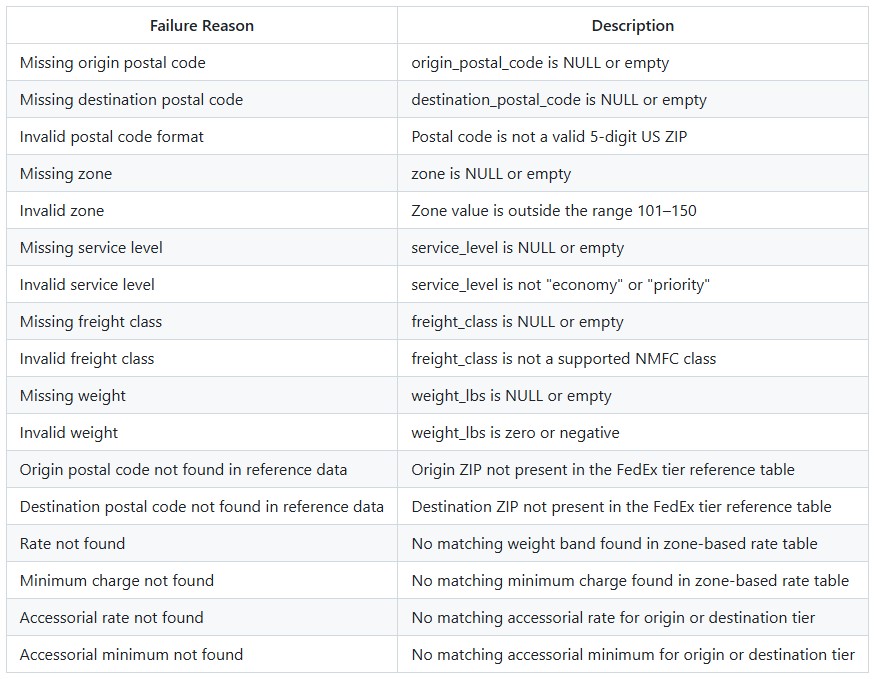
If a lane cannot be costed, the failure_reasons column will contain one or more of the following:

The Less Than Truckload Costing utility solves the challenge of pricing less-than-truckload (LTL) shipments when carrier rate data is complex and varies by service level, distance, and weight. Rather than manually looking up rates in carrier tariff tables, this workflow automates the entire process using FedEx Express Freight standard list rates. The utility expects a lanes-to-cost table containing shipment details including origin, destination, distance, weight, and desired service level. After running the utility, users receive a fully costed table with calculated transportation costs.
The Less Than Truckload Costing Utility is available on the Resource Library, from which you can download it or copy it to your Optilogic account. Learn more about the Resource Library in this How to use the Resource Library help center article.
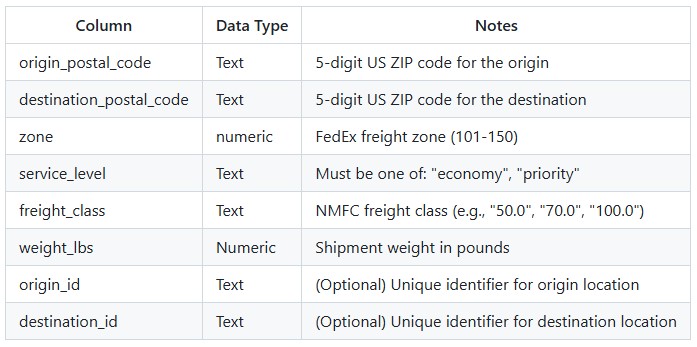
Sample Data
System Utility
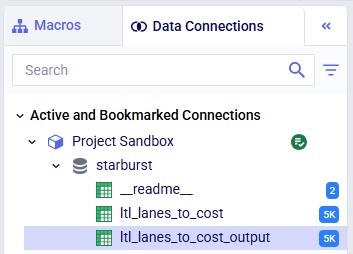
The steps to use this utility are as follows. These are illustrated with screenshots below.
Screenshots of the steps:
Key Constraints:
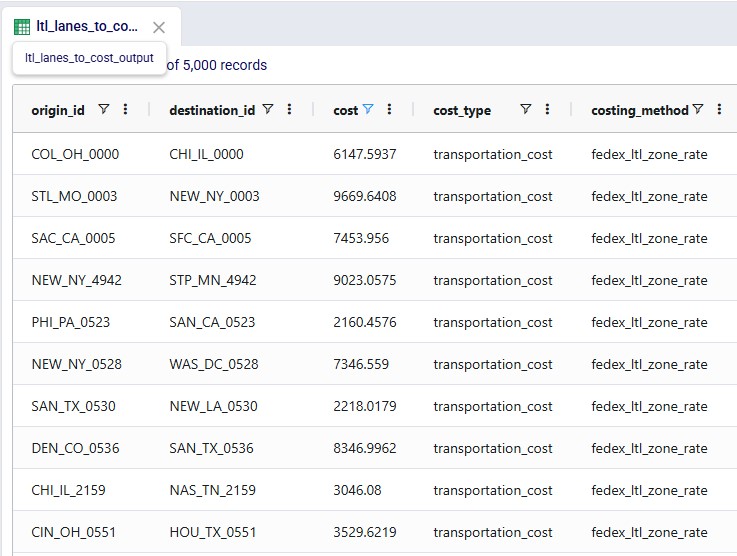
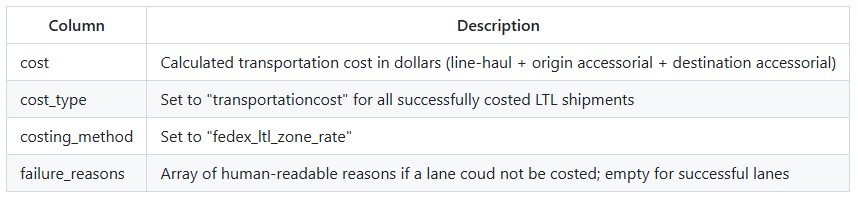
The utility produces an output table containing all lanes from the input with the following additional columns populated:
LTL costs are calculated as a three-component sum:
Each component is calculated independently using the formula:
Where:
FedEx Freight zones (101–150) represent the transit distance and pricing tier between an origin and destination. Zones are assigned by FedEx based on origin and destination ZIP codes. You can determine the correct zone for a lane using the FedEx Freight zone chart or a zone lookup tool.
Higher zone numbers generally correspond to longer distances and higher rates.
The utility supports the following standard NMFC freight classes:
Freight class values are case-insensitive and will be normalized automatically. Common formats such as "60", "60.0", and "60.00" are all accepted and treated as equivalent.
Service level values are normalized to lowercase automatically, so "Economy", "ECONOMY", and "economy" are all accepted.
If a lane cannot be costed, the failure_reasons column will contain one or more of the following:


