The Full Truckload Costing utility solves the common problem of missing transportation cost data when building supply chain models. Rather than requiring users to manually research rates for every lane, this workflow automatically derives costs from a company's existing shipment history. The utility expects two input tables: a lanes-to-cost table containing the origin-destination pairs that need pricing, and an optional historical shipments table containing preprocessed cost data. After running the utility, users receive a fully costed lanes table with confidence levels for each estimate.
Sample lanes_to_cost CSV file (5,000 lanes across North America)
Sample historical_shipments_processed CSV file (3,500 historical lane costs)
System Utility
Full Truckload Costing utility accessible via the "Run Utility" task in DataStar
How To Use
The steps to use this utility are as follows. These are illustrated with screenshots below.
Prepare your input data:
Create a lanes_to_cost table with all required columns (see Input Requirements)
Optionally create a historical_shipments_processed table with your preprocessed historical data
Ensure data passes validation requirements (unique keys, no NULLs in join columns, valid postal codes)
Upload your data to a database in DataStar
Run the utility:
Open the "Run Utility" task in DataStar
Select "Full Truckload Costing" from the available utilities
Configure the parameters:
Database: Select your Optilogic database
Schema: Select the schema containing your tables
Lanes Table: Select your lanes_to_cost table
Historical Table: (Optional) Select your historical_shipments_processed table
Output Table: Specify the output table name (defaults to lanes table name + "_output")
Keep Working Tables: Toggle on to retain intermediate tables for debugging
Verbose: Toggle on for detailed logging
Review the output table containing costed lanes with confidence levels
Screenshots of the steps:
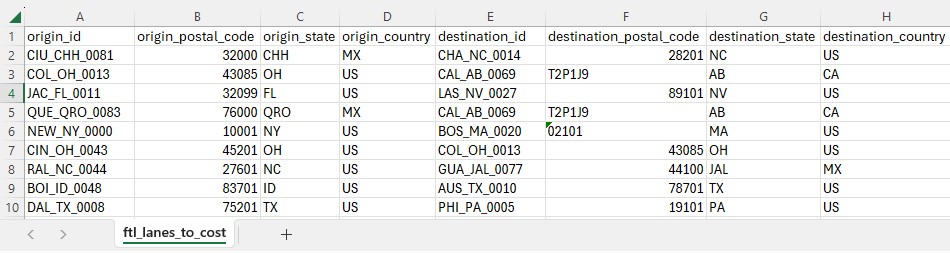
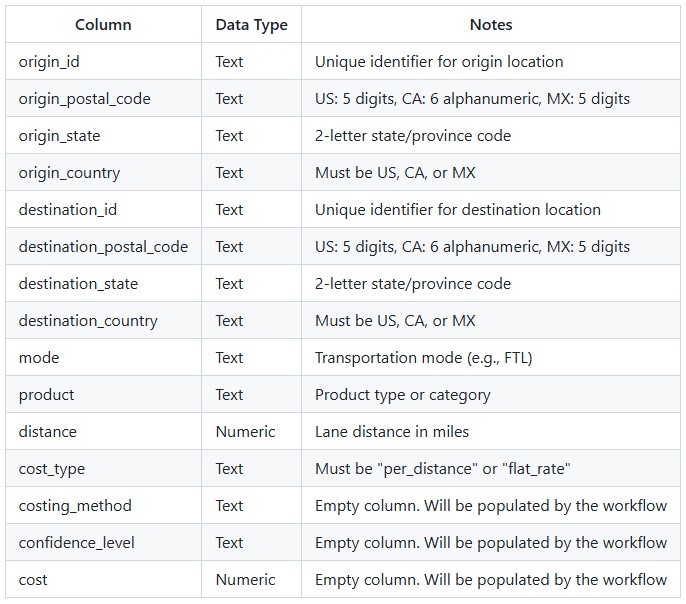
The first 10 records in the ftl_lanes_to_cost.csv; not all columns are shown, see also the next screenshot.
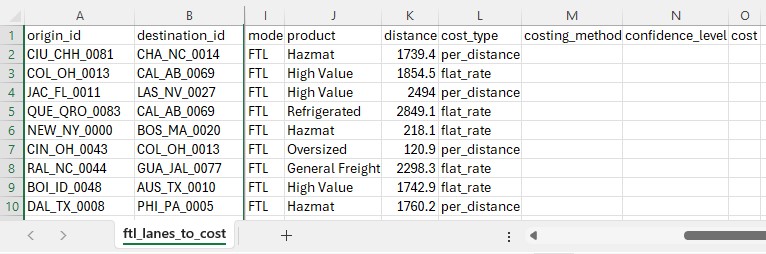
Again, the first 10 records of the ftl_lanes_ to_cost.csv, now showing the rest of the columns (I-O).
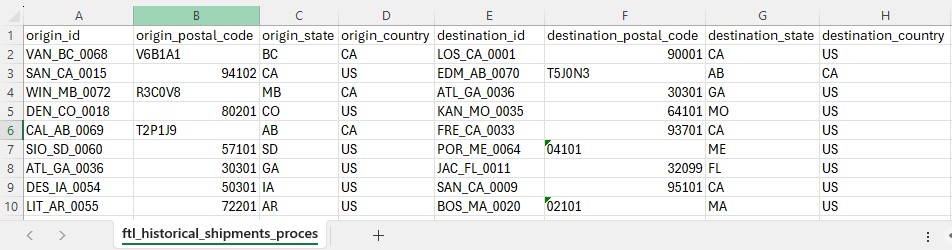
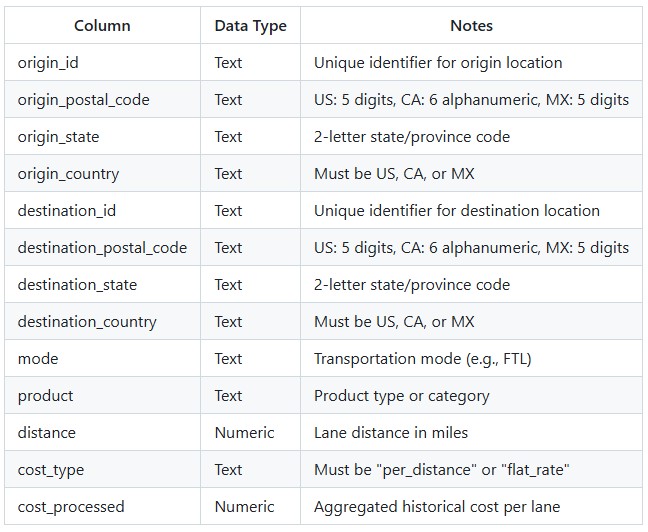
The first 10 records in the ftl_historical_shipments_processedt.csv; not all columns are shown, see also the next screenshot.
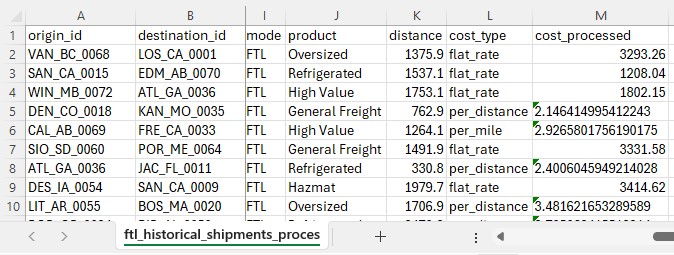
Again, the first 10 records of the ftl_historical_shipments_processed.csv file, now showing the rest of the columns (I-M).
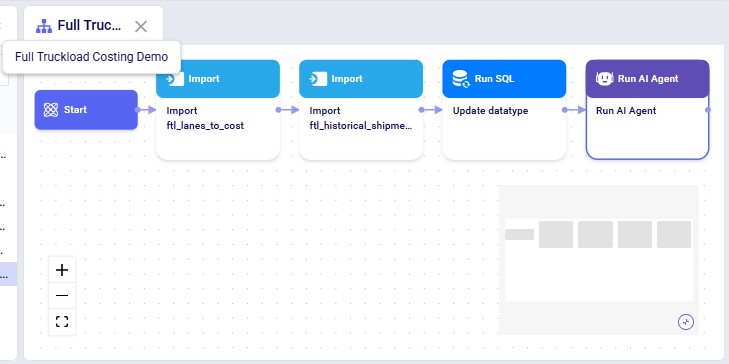
This macro is available in the Full Truckload Costing Demo project copied from the Resource Library. All tasks are configured and ready to go: the "Import ftl_lanes_to_cost" Import task imports the data from the CSV data connection into the Project Sandbox with table name "ftl_lanes_to_cost", the "Import ftl_historical_shipments_processed" Import task imports the data from the other SCV data connection into the Project Sandbox with table name "ftl_historical_shipments_processed", the "Update datatype" Run SQL task changes the data type of the Cost column, and the "Run AI Agent" Run AI Agent task looks up the full truckload freight costs and adds them to the data in a new output table named "ftl_lanes_to_cost_output". The configuration of this Run AI Agent task is shown in the next 2 screenshots. If you are using your own lanes to cost and historical shipments files, you will need to update the Import tasks to point them to your own data as the source data, and possibly update the Run SQL task.
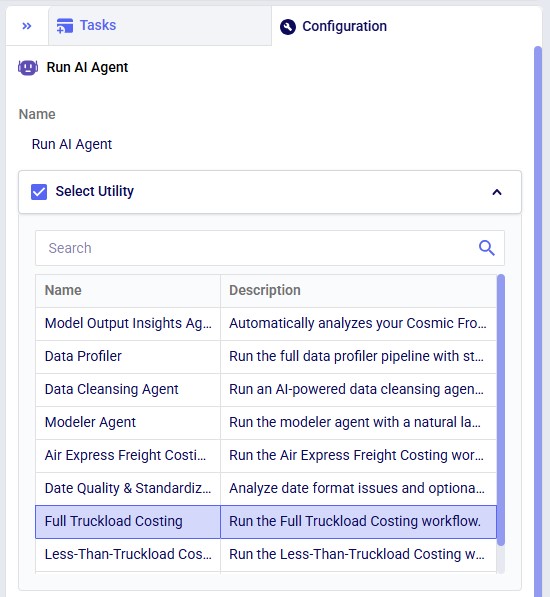
The Select Utility section of the configuration of the Run AI Agent task where Full Truckload Costing is chosen from the list of Utilities.
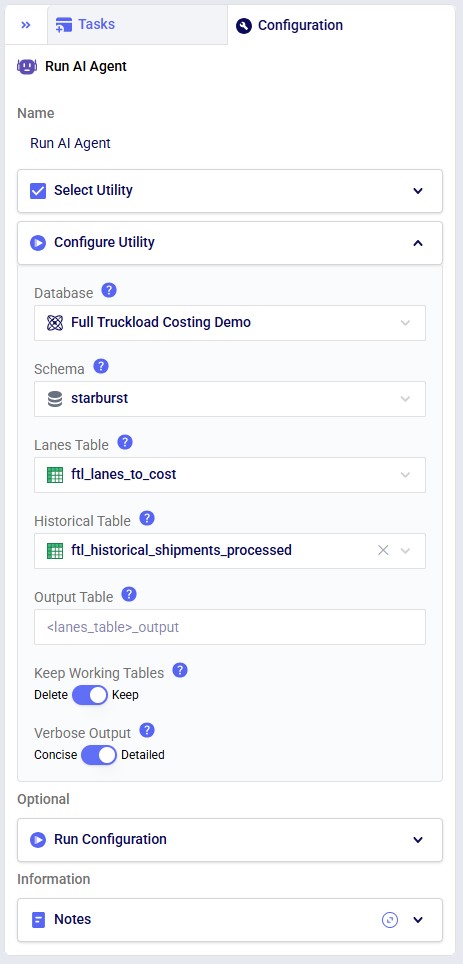
Configuration of the "Full Truckload Costing" Run AI Agent task. The Database is the Project Sandbox of the DataStar project, the ftl_lanes_to_cost table is used as the input table for which full truckload rates need to be looked up, the optional historical table option is used in this case and pointed to the ftl_historical_shipments_processed table, the output table is left at the default and will therefore be named ftl_lanes_to_cost_output. The user has chosen to keep working tables (appended with _working) and to see detailed outputs in the Task Logs tab when this task is executed. Note that in the Run Configuration section the Resource Size is changed from 3XS to S, which is recommended when running this costing utility.
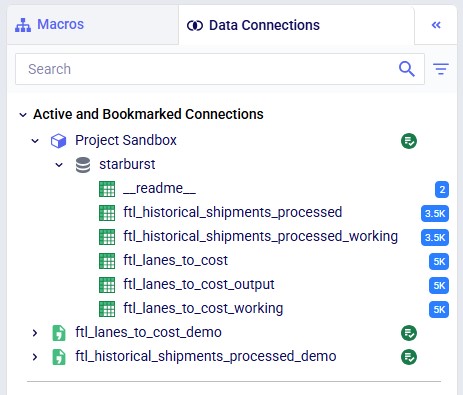
On the Data Connections tab we see the 2 CSV connections with the original data at the bottom. In the Project Sandbox, the ftl_lanes_to_cost table contains the imported data from the CSV connection, and the ftl_lanes_to_cost_output table contains the original data with the looked up costs added. The _ working tables are intermediate tables which are used to leave the originals untouched.
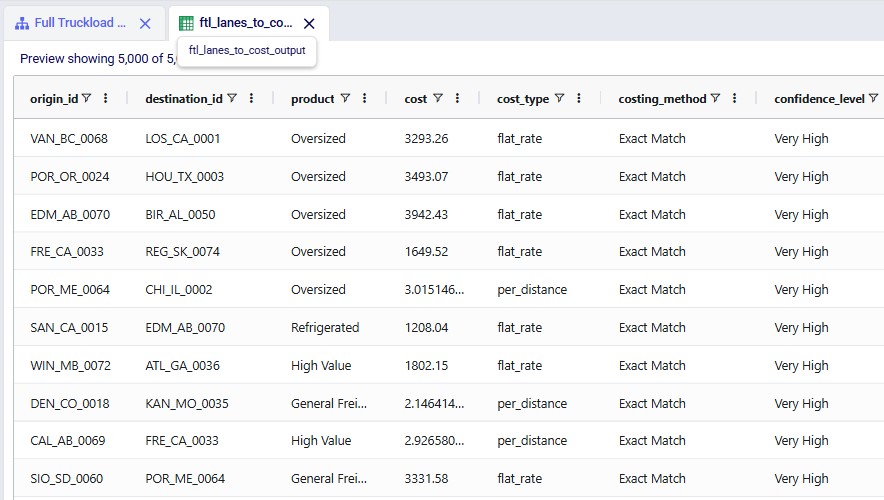
Ten records of the 5,000 in the ftl_lanes_to_ cost_ output table are shown here; we see the populated cost, cost_ type, costing_method, and confidence_ level columns.
Input Requirements
Lanes to Cost Table (Required)
Key Constraints:
Each combination of (origin_id, destination_id, mode, product, cost_type) must be unique
Each combination of (origin_id, destination_id, mode, product, cost_type) must be unique
Historical data must be preprocessed: outliers removed, costs aggregated to one value per unique lane
No NULL values allowed in join columns
Output Description
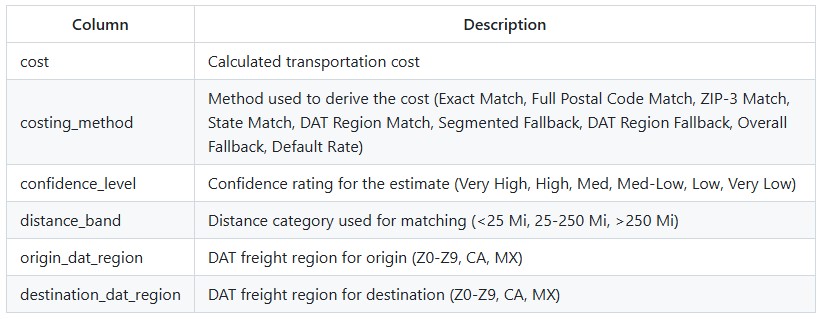
The utility produces an output table containing all lanes from the input with the following additional columns populated:
Costing Pipeline
The utility processes lanes through a sequential pipeline, with each step only processing lanes that still have NULL costs:
Validation - Verifies input data meets all requirements
Copy & Enrich - Creates working copies and adds distance bands and DAT regions
Exact Match - Matches on (origin_id, destination_id, mode, product, cost_type) - Confidence: Very High
Approximate Match - Progressive geographic relaxation:
Full Postal Code Match - Confidence: High
ZIP-3 Match - Confidence: Med
State Match - Confidence: Med-Low
DAT Region Match - Confidence: Low
Fallback Costing - For lanes without historical matches:
Segmented average by cost_type/distance_band/mode - Confidence: Med
DAT Region benchmark rates - Confidence: Med-Low
Overall average $/mile - Confidence: Low
Default rate ($1.60/mile) - Confidence: Very Low
Copy to Output - Writes final results to output table
Tips & Notes
If no historical shipments table is provided, the utility will skip exact and approximate matching and only apply fallback costing using default benchmark rates.
The workflow is fully deterministic - given the same inputs, it will always produce the same outputs.
Original input tables are never modified. The utility creates working copies for all processing.
For best results, ensure your historical shipments table has good coverage of the geographic regions and product types in your lanes to cost.
Lanes with "Very Low" confidence (default rate) indicate gaps in your historical data. Consider collecting actual rate quotes for these lanes.
The DAT Region mapping covers the continental US, Canada, and Mexico. US states are mapped to 10 freight regions (Z0-Z9) based on typical freight market patterns.
Distance bands help match lanes with similar characteristics: <25 miles (short haul), 25-250 miles (regional), >250 miles (long haul).
The Full Truckload Costing utility solves the common problem of missing transportation cost data when building supply chain models. Rather than requiring users to manually research rates for every lane, this workflow automatically derives costs from a company's existing shipment history. The utility expects two input tables: a lanes-to-cost table containing the origin-destination pairs that need pricing, and an optional historical shipments table containing preprocessed cost data. After running the utility, users receive a fully costed lanes table with confidence levels for each estimate.
Sample lanes_to_cost CSV file (5,000 lanes across North America)
Sample historical_shipments_processed CSV file (3,500 historical lane costs)
System Utility
Full Truckload Costing utility accessible via the "Run Utility" task in DataStar
How To Use
The steps to use this utility are as follows. These are illustrated with screenshots below.
Prepare your input data:
Create a lanes_to_cost table with all required columns (see Input Requirements)
Optionally create a historical_shipments_processed table with your preprocessed historical data
Ensure data passes validation requirements (unique keys, no NULLs in join columns, valid postal codes)
Upload your data to a database in DataStar
Run the utility:
Open the "Run Utility" task in DataStar
Select "Full Truckload Costing" from the available utilities
Configure the parameters:
Database: Select your Optilogic database
Schema: Select the schema containing your tables
Lanes Table: Select your lanes_to_cost table
Historical Table: (Optional) Select your historical_shipments_processed table
Output Table: Specify the output table name (defaults to lanes table name + "_output")
Keep Working Tables: Toggle on to retain intermediate tables for debugging
Verbose: Toggle on for detailed logging
Review the output table containing costed lanes with confidence levels
Screenshots of the steps:
The first 10 records in the ftl_lanes_to_cost.csv; not all columns are shown, see also the next screenshot.
Again, the first 10 records of the ftl_lanes_ to_cost.csv, now showing the rest of the columns (I-O).
The first 10 records in the ftl_historical_shipments_processedt.csv; not all columns are shown, see also the next screenshot.
Again, the first 10 records of the ftl_historical_shipments_processed.csv file, now showing the rest of the columns (I-M).
This macro is available in the Full Truckload Costing Demo project copied from the Resource Library. All tasks are configured and ready to go: the "Import ftl_lanes_to_cost" Import task imports the data from the CSV data connection into the Project Sandbox with table name "ftl_lanes_to_cost", the "Import ftl_historical_shipments_processed" Import task imports the data from the other SCV data connection into the Project Sandbox with table name "ftl_historical_shipments_processed", the "Update datatype" Run SQL task changes the data type of the Cost column, and the "Run AI Agent" Run AI Agent task looks up the full truckload freight costs and adds them to the data in a new output table named "ftl_lanes_to_cost_output". The configuration of this Run AI Agent task is shown in the next 2 screenshots. If you are using your own lanes to cost and historical shipments files, you will need to update the Import tasks to point them to your own data as the source data, and possibly update the Run SQL task.
The Select Utility section of the configuration of the Run AI Agent task where Full Truckload Costing is chosen from the list of Utilities.
Configuration of the "Full Truckload Costing" Run AI Agent task. The Database is the Project Sandbox of the DataStar project, the ftl_lanes_to_cost table is used as the input table for which full truckload rates need to be looked up, the optional historical table option is used in this case and pointed to the ftl_historical_shipments_processed table, the output table is left at the default and will therefore be named ftl_lanes_to_cost_output. The user has chosen to keep working tables (appended with _working) and to see detailed outputs in the Task Logs tab when this task is executed. Note that in the Run Configuration section the Resource Size is changed from 3XS to S, which is recommended when running this costing utility.
On the Data Connections tab we see the 2 CSV connections with the original data at the bottom. In the Project Sandbox, the ftl_lanes_to_cost table contains the imported data from the CSV connection, and the ftl_lanes_to_cost_output table contains the original data with the looked up costs added. The _ working tables are intermediate tables which are used to leave the originals untouched.
Ten records of the 5,000 in the ftl_lanes_to_ cost_ output table are shown here; we see the populated cost, cost_ type, costing_method, and confidence_ level columns.
Input Requirements
Lanes to Cost Table (Required)
Key Constraints:
Each combination of (origin_id, destination_id, mode, product, cost_type) must be unique
Each combination of (origin_id, destination_id, mode, product, cost_type) must be unique
Historical data must be preprocessed: outliers removed, costs aggregated to one value per unique lane
No NULL values allowed in join columns
Output Description
The utility produces an output table containing all lanes from the input with the following additional columns populated:
Costing Pipeline
The utility processes lanes through a sequential pipeline, with each step only processing lanes that still have NULL costs:
Validation - Verifies input data meets all requirements
Copy & Enrich - Creates working copies and adds distance bands and DAT regions
Exact Match - Matches on (origin_id, destination_id, mode, product, cost_type) - Confidence: Very High
Approximate Match - Progressive geographic relaxation:
Full Postal Code Match - Confidence: High
ZIP-3 Match - Confidence: Med
State Match - Confidence: Med-Low
DAT Region Match - Confidence: Low
Fallback Costing - For lanes without historical matches:
Segmented average by cost_type/distance_band/mode - Confidence: Med
DAT Region benchmark rates - Confidence: Med-Low
Overall average $/mile - Confidence: Low
Default rate ($1.60/mile) - Confidence: Very Low
Copy to Output - Writes final results to output table
Tips & Notes
If no historical shipments table is provided, the utility will skip exact and approximate matching and only apply fallback costing using default benchmark rates.
The workflow is fully deterministic - given the same inputs, it will always produce the same outputs.
Original input tables are never modified. The utility creates working copies for all processing.
For best results, ensure your historical shipments table has good coverage of the geographic regions and product types in your lanes to cost.
Lanes with "Very Low" confidence (default rate) indicate gaps in your historical data. Consider collecting actual rate quotes for these lanes.
The DAT Region mapping covers the continental US, Canada, and Mexico. US states are mapped to 10 freight regions (Z0-Z9) based on typical freight market patterns.
Distance bands help match lanes with similar characteristics: <25 miles (short haul), 25-250 miles (regional), >250 miles (long haul).