DataStar is Optilogic’s new AI-powered data product designed to help supply chain teams build and update models & scenarios and power apps faster & easier than ever before. It enables users to create flexible, accessible, and repeatable workflows with zero learning curve—combining drag-and-drop simplicity, natural language AI, and deep supply chain context.
Today, up to an estimated 80% of a modeler's time is spent on data—connecting, cleaning, transforming, validating, and integrating it to build or refresh models. DataStar drastically shrinks that time, enabling teams to:
Answer more questions faster
Unlock repeatable value across business review
Focus on strategic decisions, not data wrangling
The 2 main goals of DataStar are 1) ease of use, and 2) effortless collaboration, these are achieved by:
Providing AI-powered, no-code automation with deep supply chain context
Supporting drag-and-drop workflows, natural language commands, and advanced scripting (SQL/Python)
Full integration into the Optilogic platform: users can prep data, trigger model & scenario runs, and push insights to apps or dashboards
Enabling scalable, collaborative, cloud-native modeling for repeatable decision-making at speed
In this documentation, we will start with a high-level overview of the DataStar building blocks. Next, creating projects and data connections will be covered before diving into the details of adding tasks and chaining them together into macros, which can then be run to accomplish the data goals of your project.
Before diving into more details in later sections, this section will describe the main building blocks of DataStar, which include Data Connections, Projects, Macros, and Tasks.
Data Connections
Since DataStar is all about working with data, Data Connections are an important part of DataStar. These enable users to quickly connect to and pull in data from a range of data sources. Data Connections in DataStar:
Are global to the DataStar application – meaning each project within DataStar can use any of the data sources that have been set up as Data Connections.
Can also be set up from within a DataStar project – they then become available for use in other DataStar projects too.
Can be of the following types currently:
Postgres – an open-source relational database management system that supports both SQL and JSON querying
CSV Files – files containing data in the comma separated values format, which can be created by and opened in Excel
Cosmic Frog Models – a Cosmic Frog model which is a Postgres database using a specific data schema called Anura. Often the projects in DataStar will populate Cosmic Frog model input tables to build complete models that are ready to be run by one of the Cosmic Frog engines and/or read in Cosmic Frog output tables for output analysis
Excel – spreadsheet editor developed by Microsoft for Windows (beta version)
Connections to other common data resources such as MySQL, OneDrive, SAP, and Snowflake will become available as built-in connection types over time. Currently, these data sources can be connected to by using scripts that pull them in from the Optilogic side or using ETL tools or automation platforms that push data onto the Optilogic platform. Please see the "DataStar: Data Integration" article for more details on working with both local and external data sources.
Users can check the Resource Library for the currently available template scripts and utilities. These can be copied to your account or downloaded and after a few updates around credentials, etc. you will be able to start pulling data in from external sources:
Go to the Resource Library application while logged in on the Optilogic platform.
Click on the DataStar button at the right top to filter the list of resources for those specific to DataStar.
Optionally, use the Tags drop-down to filter the list further down to find what you are looking for quickly. Here we have selected 2 tags: "Extensibility Tool" and "Utility".
Browse the list and click on a resource of interest to select it, here we clicked on the "Google Big Query Insert Script" resource.
After clicking on it, a description of the resource appears on the right hand-side.
Associated files can be downloaded by using these Download buttons.
The blue buttons at the right bottom can be used to gain access to this resource. Click on the Copy to Account button to start using the resource on the Optilogic platform. Scripts can for example be viewed, edited, and run in the Lightning Editor application.
Projects, Macros, and Tasks
Projects are the main container of work within DataStar. Typically, a Project will aim to achieve a certain goal by performing all or a subset of importing specific data, then cleansing, transforming & blending it, and finally publishing the results to another file/database. The scope of DataStar Projects can vary greatly, think for example of following 2 examples:
Cleanse and filter a specific set of historical supply chain data.
Build a Cosmic Frog model from scratch using the raw data from your data sources, then run the model, analyze its outputs, and finally generate reports at the desired level of aggregation.
Projects consist of one or multiple macros which in turn consist of 1 or multiple tasks. Tasks are the individual actions or steps which can be chained together within a macro to accomplish a specific goal.
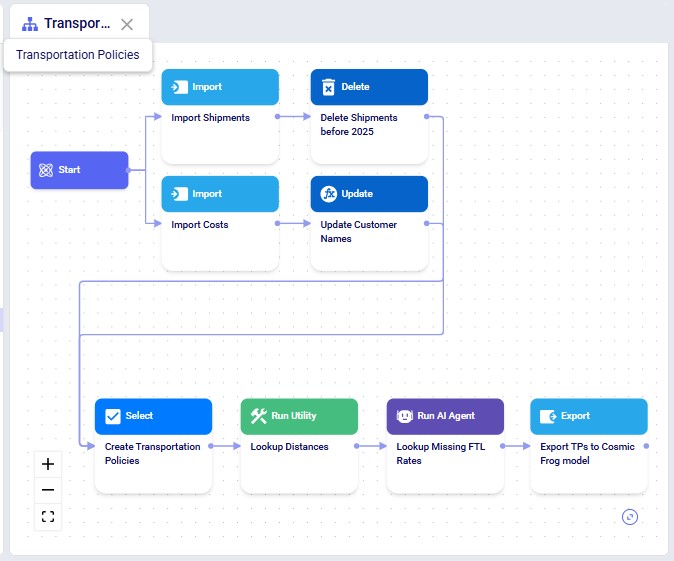
The next screenshot shows an example Macro called "Transportation Policies" which consists of 8 individual tasks that are chained together to create transportation policies for a Cosmic Frog model from imported Shipments and Costs data:
Project Sandbox
Every project by default contains a Data Connection named Project Sandbox. This data connection is not global to all DataStar projects; it is specific to the project it is part of. The Project Sandbox is a Postgres database where users generally import the raw data from the other data connections into, perform transformations in, save intermediate states of data in, and then publish the results out to a Cosmic Frog model (which is a data connection different than the Project Sandbox connection). It is also possible that some of the data in the Project Sandbox is the final result/deliverable of the DataStar Project or that the results are published into a different type of file or system that is set up as a data connection rather than into a Cosmic Frog model.
How Data Connections, Projects, and Macros Relate to Each Other
The next diagram shows how Data Connections, Projects, and Macros relate to each other in DataStar:
In this example, there are 7 Data Connections configured in DataStar, see the rectangle with green background on the left:
An Excel connection called Historical Data
A Postgres database connection called Enterprise Data
An Excel connection called Location Data
A CSV connection called Cost Data
A CSV connection called Capacity Data
A Cosmic Frog connection called Neo NA Model
A Cosmic Frog connection called Global Model
Note that the 2 Cosmic Frog connections displayed here on the right-hand side are the same 2 as shown in the list on the left, they are just repeated in the diagram to facilitate explaining the flow of data.
There are 2 projects set up in DataStar, see the 2 rectangles with blue background in the middle:
Project 1 creates Policies tables for the Cosmic Frog model named Neo NA Model, a network optimization model in the Northern Americas geography.
Project 2 builds, runs, and analyzes a complete Cosmic Frog model named Global Model from raw data.
Looking at Project 1, we see that:
It uses 3 of the 7 Data Connections available (blue arrows):
Two to pull data in from: the Historical Data, and Cost Data connections.
One to publish data into: the Neo NA Model.
It has its own Project Sandbox as an additional Data Connection which is specific to this project only.
It contains 3 macros: Shipments, Production, and Inventory. The Shipments macro can look similar to the example one seen in the previous screenshot.
The 3 macros pull data from the Historical Data, Cost Data, and Project Sandbox connections.
The 3 macros publish data into the Project Sandbox and the Neo NA model connections. The completed Transportation Policies, Production Policies, and Inventory Policies tables are published into the Cosmic Frog model.
Similarly, looking at Project 2, we follow the yellow arrows to understand which Data Connections are used to pull data from and publish data into. Note that the Global Model connection is used to publish results into by the “Publish to Model” macro which populates the model’s input tables and it is also used as a connection to pull data from for the “Output Analysis” macro after the model has run to completion.
As referenced above too, to learn more about working with both local and external data, please see this "DataStar: Data Integration" article.
Creating Projects & Data Connections
On the start page of DataStar, the user will be shown their existing projects and data connections. They can be opened, or deleted here, and users also have the ability to create new projects and data connections from this start page.
How to Create a New Project
The next screenshot shows the existing projects in card format:
When logged into the Optilogic platform, click on the DataStar icon in the list of available applications on the left-hand side to open DataStar. Your DataStar icon may be in a different location in the list, and if it is not visible at all, then click on the icon with 3 horizontal dots to show any applications that are not shown currently.
We are on the Projects tab of the start page in the DataStar application.
The projects are shown in card format (the left icon); the other option is to show them as a list (the right icon).
When hovering over a project, the options to edit the project (rename it and/or update its description) and to delete the project become visible. When clicking on the delete project icon, a message asking the user to confirm they want to delete the project comes up before actually deleting it.
Users can quickly search the list of projects by typing in the Search text box and projects containing the text will be filtered out.
New projects can be created by clicking on the Create Project button in the toolbar at the top of the DataStar application:
The user clicked on the Create Project button which opened the Create Project form.
Here, a Project Name can be entered.
Optionally, a Project Description can be added.
Under Project Type, users can either create a new Empty Project or choose to create a Project from Template. Here, we select the Empty Project option; Template Proejects are discussed in the next section.
Click on the Edit button to change the project’s appearance by choosing an icon and color.
Click on the Add Project button to create the project.
Note that on the right-hand side, Help for the currently open DataStar form is shown.
If at any point during the creation of a new project the user decides they do not want to go ahead with it, they can close the form by either clicking on the back icon at the left top or the cross icon at the right top.
Using Template Projects
If on the Create Project form a user decides they want to use a Template Project rather than a new Empty Project, it works as follows:
The Project from Template option has been chosen on the Create Project form.
This brings up a list of available template projects users can choose from. Hovering over a template project will bring up a textbox with a short description of the template project.
Click on a template project to select it, it will then be greyed out and unavailable to select again. In addition:
The template project will be pinned to the top of the list with a darker background to indicate that this is the currently selected template project.
The project name will be automatically filled out with the name of the selected template project.
Users can choose to add an optional description.
When a template project is selected, information about it will be shown on the right-hand side of the Create Project form.
A preview of detailed documentation of the template project is shown too. Options for zooming, downloading and printing are available for this documentation; click on the icon with 3 vertical dots to see all options.
Like with new empty projects, the icon and background color for the template project can be edited by clicking on the Edit button.
Click on Add Project to make the project available from within DataStar. It will now appear on the Projects tab on DataStar's start page.
These template projects are also available on Optilogic's Resource Library:
Go to the Resource Library application while logged in on the Optilogic platform.
Click on the DataStar button at the right top to filter the list of resources for those specific to DataStar.
Use the Tags drop-down to filter the list further down to those that are tagged with "Project".
Browse the list and click on a project of interest, here we clicked on the "Detect and Report Outliers" resource.
After clicking on it, a description of the resource appears on the right hand-side.
Associated files can be downloaded, a script and documentation in PDF format are available for download for this resource.
The blue buttons at the right bottom can be used to gain access to this resource. Click on the Copy to Account button to start using this project in DataStar.
After the copy process completes, we can see the project appear in the Explorer and in the Project list in DataStar:
We have expanded the Explorer application to see the files and folders in our Optilogic account.
Under /My Files/DataStar, a new folder "Profile and Cleanse Data" was created. It contains 1 file with a .dstar extension, this is a DataStar project database (underneath a Postrges database).
In the central part of the platform DataStar is the active application as that is the one selected in the list of applications.
We are on the Projects tab on the start page in DataStar.
The list of projects is shown in list format here where the most recent project is shown at the top of the list. This is the "Profile and Cleanse Data" project we just copied from the Resource Library. Click on it to open it and start exploring.
Note that any files needed for data connections in template projects copied from the Resource Library can be found under the "Sent to Me" folder in the Explorer. They will be in a subfolder named @datastartemplateprojects#optilogic (the sender of the files).
How to Create a New Data Connection
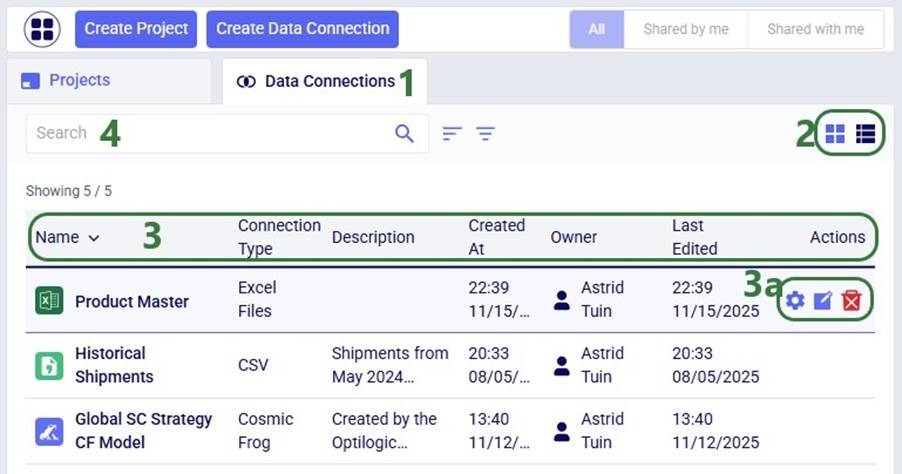
The next screenshot shows the Data Connections that have already been set up in DataStar in list view:
We are on the Data Connections tab of the start page in the DataStar application.
The Data Connections are shown in list format (right icon); the other option is to show them in card format (left icon) similar to the screenshot above of the Projects in card format.
For each Data Connection we see the following details in the list: Name, Connection Type, Description, Created At, Owner, Last Edited, and Actions. Clicking on the column headers sorts the table by that column in ascending order, clicking again will sort in descending order, and clicking a third time takes the sort off. Holding both the Shift and Ctrl buttons down and next clicking on multiple column headers will sort the table by those multiple columns.
Note that when hovering over the Actions field in a data connection row, icons to rename and delete the connection become visible. When users click on the delete icon, a message asking the user to confirm they want to delete the data connection comes up before actually deleting it.
Users can quickly search the list of data connections by typing in the Search text box and connections containing the text will be filtered out.
New data connections can be created by clicking on the Create Data Connection button in the toolbar at the top of the DataStar application:
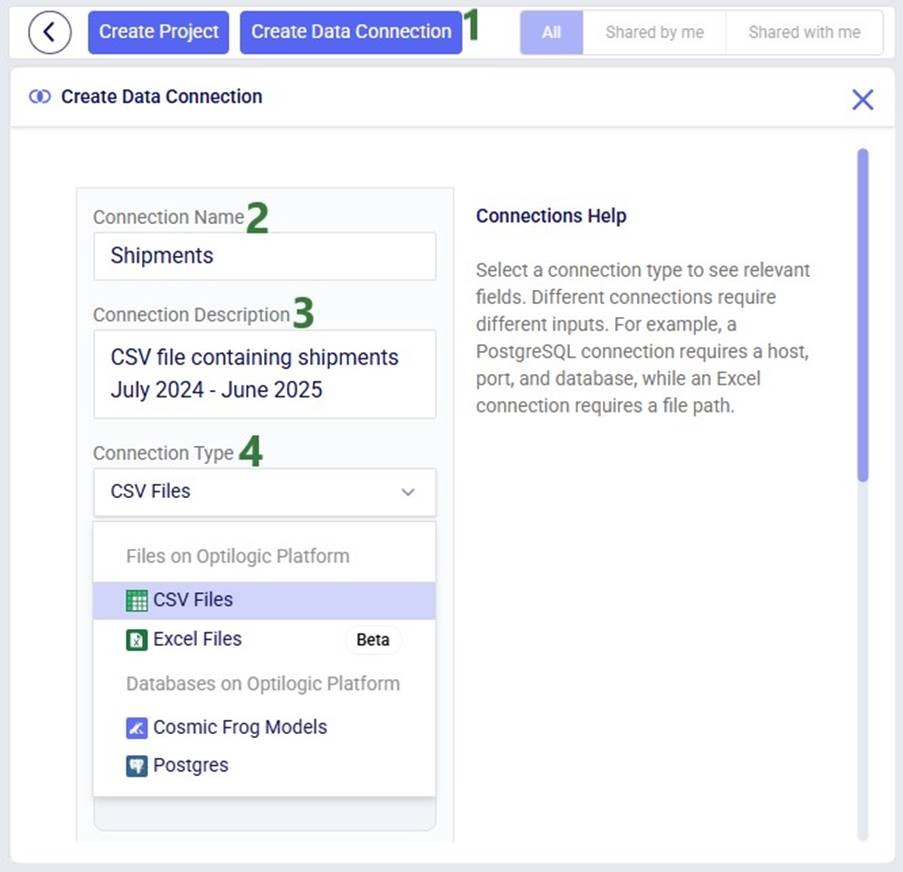
The Create Data Connection form has been opened by clicking on the Create Data Connection button.
First, a Data Connection Name needs to be entered.
Optionally, the user can write a Connection Description.
The type of connection can be chosen from the Connection Type drop-down list. See the “Data Connections” section further above for a full list of connection types and a short description of each.
The remainder of the Create Data Connection form will change depending on the type of connection that was chosen as different types of connections require different inputs (e.g. host, port, server, schema, etc.). In our example, the user chooses CSV Files as the connection type:
The Connection Type is now showing CSV Files per the selection user made.
There are 2 options to select the CSV source file:
The CSV file to be used for the Data Connection can be dragged and dropped onto this “Drag and drop” area from user’s computer. It will then be uploaded to the user’s /MyFiles/DataStar folder on the Optilogic platform. In case a file of the same name already exists in that location, it will be overwritten.
The user can browse the list of CSV files that exist in their Optilogic account already (not limited to files under /MyFiles/DataStar, will show all CSV files in their account) to select one as the source for the data connection. Note that:
We can quickly find files of interest by typing in the Search box at the top of the list to filter out any files containing the typed text in their names.
In case not all 3 columns shown in the screenshot are visible, users can scroll right to also see the location in user’s Optilogic workspace of the file.
Options to customize the grid to users' needs (e.g. sorting, changing the order of columns, etc.) are explained in the Appendix.
After selecting the CSV file to be used for the Data Connection, users can optionally configure the data connection further with the options provided on the right-hand side of the form. See the CSV File Data Connection help center article for more details on these configuration options. Once done configuring the data connection, click on the Add Connection button to create the new data connection.
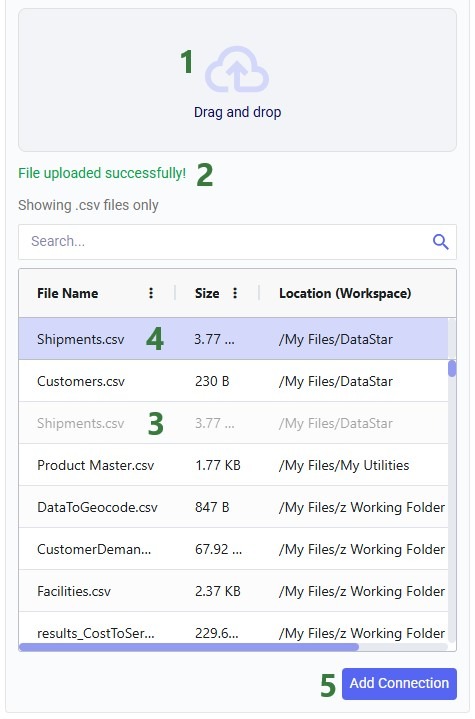
In our walk-through here, the user drags and drops a Shipments.csv file from their local computer on top of the Drag and drop area:
The user dragged and dropped their local Shipments.csv file onto the “Drag and drop” area.
Once the upload of the file is finished, a message in green font indicating the upload completed successfully is shown.
The Shipments.csv file is now listed in the list of CSV files the user has available in their Optilogic account. As expected, the location of this file is /MyFiles/DataStar. When clicking on the file in the list to select it, it becomes greyed out to indicate it is already selected.
The selected file will be pinned to the top of the list, to prevent the user having to scroll through the list to find the currently selected file.
The user can optionally configure any of the options provided on the right-hand side of the form, and then click on the Add Data Connection button to create the connection.
Inside a DataStar Project
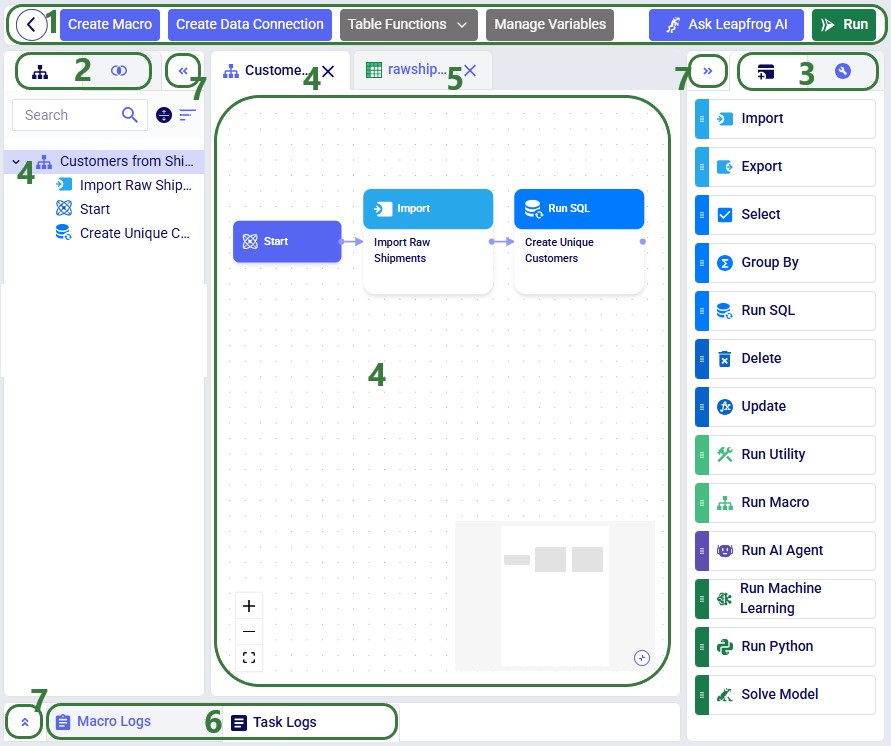
Now let us look at a project when it is open in DataStar. We will first get a lay of the land with a high-level overview screenshot and then go into more detail for the different parts of the DataStar user interface:
At the top of the DataStar application, users will find a toolbar, which contains following options from left to right:
Clicking on the back button all the way to the left will take user back to DataStar’s start page where the lists of existing projects and data connections are shown, see also the previous section “Creating Projects & Data Connections”.
Create Macro button: click on this button to create a new Macro.
Create Data Connection button: click on this button to create a new Data Connection.
Table Functions drop-down menu. When a table from a data connection is open in DataStar, this menu will become available and allows a user to export the table to CSV or open it in the SQL Editor application on the Optilogic platform. See also the "Viewing a Connection's Table" section further below.
Manage Variables button: in future, this button will be enabled so users can pass in values that can be used/updated in their macros.
Ask Leapfrog AI button: this opens the Leapfrog window. Start or continue a conversation with Leapfrog here. Use natural language prompts and Leapfrog will configure Update and Run SQL tasks for you! See the Leapfrog section further below for more details.
The Run button is used to start any task or macro runs.
In the pane on the left-hand side of the application, either the list of Macros that the project contains (left tab) or the list of available Data Connections (right tab) is shown. In this screenshot, the Macros tab is the active tab.
Macros can be expanded/collapsed; when expanded you see a list of all the tasks/macros that make up the macro. This will be shown in more detail below.
Likewise, data connections can also be expanded/collapsed; when expanded you see the available schemas for database connections and (for all connection types) the tables contained in the data connection.
In the pane on the right-hand side of the application, there are 2 tabs:
Tasks – from here tasks can be chosen and dragged and dropped onto the Macro Canvas (the central part of the DataStar application) to add them to the currently active macro.
Configuration – the specific configuration parameters for the currently selected task can be set or updated here.
The central part of DataStar is called the Macro Canvas. Tasks can be dragged and dropped onto here and then connected to each other to build out a macro that will accomplish a specific data process. The macro canvas becomes active when the user clicks on a macro or one of its tasks in the Macros tab on the left. The macro name is also listed in the tab at the top of the canvas.
Tables present in any of the Data Connections can also be shown in the central part of DataStar by clicking on them in the Data Connections tab. This shows as an additional tab across the top of the macro canvas. Multiple macros and tables can be opened here at the same time, and users can switch between them by clicking on the tab of the macro/table they wish to show.
Logs – the Macro Logs and Task Logs tabs are located at the bottom of the Macro Canvas. Here macro and individual task runs are tracked: which task was run when and did it complete successfully. When using Run AI Agent and Run Utility tasks, Agent & Utility steps, findings, and feedback can be found in the Task Log.
The 3 panes on the left-hand side, right-hand side, and to the bottom of the Macro Canvas can all be collapsed and expanded as desired. This can be done by clicking on the icons with the double caret symbol.
Macros Tab
Next, we will dive a bit deeper into a macro:
The macro named “Customers from Shipments” is selected on the Macros tab on the left-hand side panel of DataStar. Clicking on a macro in the Macros tab will also open it in the macro canvas.
The macro has been expanded, so we see the list of tasks that are part of this macro. Users will note that:
By default, each macro has a task named Start, which has its own specific icon and blue color. This task cannot be removed or renamed and the first actual task of the macro will be connected to it.
Tasks from the Data Transfer category have light blue icons associated with them, and those from the Automate & Execute category are green. The icon itself also indicates the type of task it is. For example, the “Import Raw Shipments” task is an Import task from the Data Transfer category, and the “Create Unique Customers” task is a Run SQL task from the Automate & Execute category.
Right-clicking on a Macro or a Task will bring up a context menu which can be used to Rename or Delete the Macro or Task. For tasks there is the extra option of Zoom to Task which will re-position the macro on the Macro Canvas such that this task is in the center.
Use the Search text box to quickly find a macro/task whose name contains the typed text.
This button can be used to expand or collapse all macros with one click.
Click on the Create Macro button in the toolbar to add a new Macro to the project.
Macro Canvas
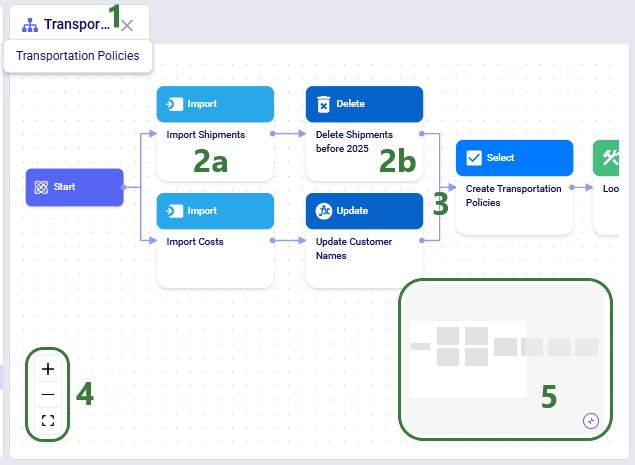
The Macro Canvas for the Transportation Policies macro is shown in the following screenshot:
The tab tells us which macro we are looking at. Note that multiple macros/connection tables can be opened here in multiple tabs and users can easily switch between them by clicking on the tab of the desired macro/table.
The canvas currently shows 5 of the tasks that are part of the "Transportation Policies" macro. The bottom part of a task contains the name and the top colored part of a task shows what type of task it is. For example:
The task at the top connected to Start is an Import task ; its name is “Import Shipments”.
The task to the right of the "Import Shipments" task is a Delete task ; its name is “Delete Shipments before 2025”.
Tasks can be dragged and dropped onto the canvas from the Tasks list in the right-hand side pane. When hovering over the canvas, DataStar will suggest which task to chain the new task to based on proximity. If the task is dropped, it will automatically be connected to this suggested task. If the task is dropped onto the canvas without connecting to a task, the user can manually connect tasks by clicking in the middle of the right edge of the first task, holding the mouse down, and then clicking in the middle of the left edge of the next task. Please note that:
DataStar helps users by showing a bigger circle when hovering over the middle of a left or right edge of a task.
Tasks can be connected to multiple other tasks. If there are for example 2 tasks connected to a third task that succeeds the first 2, then this third task will not execute until both preceding tasks have completed.
To delete a line that connects 2 tasks: click on the line (it will then become a dotted line), and then hit the Delete or Backspace key. Alternatively, right-click on the line and select Delete from the context menu that comes up.
In the left bottom corner of the canvas users have access to the following controls, from top to bottom:
Zoom in: clicking on this plus icon will increase the size of the tasks on the canvas, less of the total macro will be visible.
Zoom out: clicking on this minus icon will decrease the size of the tasks on the canvas, more of the total macro will be visible.
Fit view: clicking on the icon with 4 square corners will set the position and zoom-level of the canvas such that all tasks that are part of the macro will be shown on the canvas, using up as much of the canvas space as possible.
The grey rectangle at the right bottom of the canvas is the "Mini Map", it shows a small diagram of where all the tasks that are part of the macro are positioned. The smaller white rectangle within this grey rectangle indicates which part of the entire macro the canvas is showing currently. This is helpful when you have a macro with many tasks and you want to pan through it while it is zoomed in.
In addition to the above, please note following regarding the Macro Canvas:
Users can position the canvas as they desire by clicking on it, holding the mouse down and then moving the mouse to drag the canvas in any direction.
Users can also zoom in/out on the canvas by using the mouse or 2 fingers on a trackpad (move closer to each other to zoom out and move further apart to zoom in).
Clicking on a task in the canvas does several things:
Selects the task (i.e. highlights it) in the macro(s) it is part of in the Macros tab on the left-hand side pane.
Opens the Configuration of the task in the right-hand side pane.
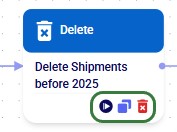
Hovering over a task will make Run Task, Dupplicate Task and Delete icons visible:
When clicking on the Run Task icon, the task is run by itself immediately. Its progress can be monitored in the Task Logs tab at the bottom of the macro canvas and in the Run Manager application on the Optilogic platform.
Use Duplicate task to create an exact copy of the task in the same macro. The name of the copied task will be the original task's name appended with (1), (2), etc.
After clicking on the Delete Task icon, a confirmation message to ensure the user wants to delete the task will come up first before the task is removed.
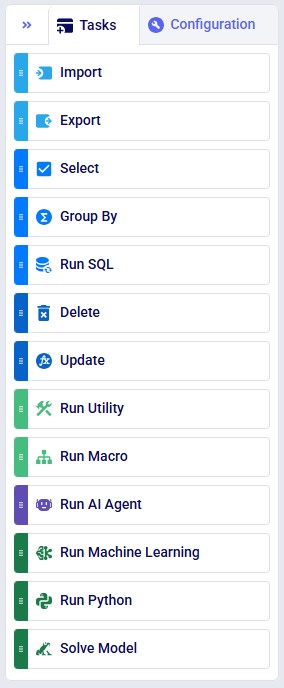
Tasks Tab
We will move on to covering the 2 tabs on the right-hand side pane, starting with the Tasks tab. Keep in mind that in the descriptions of the tasks below, the Project Sandbox is a Postgres database connection. The following tasks are currently available:
From top to bottom:
Import: import data from one data source into another. Data can be imported from a CSV, Excel, Cosmic Frog or Postgres database connection (in this case this does not include the Project Sandbox) into a Cosmic Frog or Postgres database connection. Typically used to import data from other connections into the Project Sandbox. This Quick Start Guide shows the Import task in action.
Export: export data from one data source into another. Data can be exported from a Cosmic Frog or Postgres database connection to another Cosmic Frog or Postgres database connection or to a CSV-file. Typically used to export data from the Project Sandbox into the connection that will hold the result of the DataStar workflow, such as a Cosmic Frog model. An example of using the Export task is shown in this Quick Start Guide.
Select: create a new table from a subset of columns and/or rows from one or multiple tables in a data connection, subject to easily configurable no-code joins and conditions.
Group By: create a new table by aggregating data from 1 or multiple tables in a data connection, subject to easily configurable no-code joins, grouping & aggregation statements, and optional pre- and post-aggreation conditions.
Run SQL: perform SQL queries on data in Cosmic Frog or Postgres database connections. Users can manually create their RunSQL tasks or use Leapfrog to create them. For the latter, please see this Quick Start Guide for more details.
Delete: delete all or a subset of records from a table in a Cosmic Frog or Postgres database connection.
Update: modify data in a table in a Cosmic Frog or Postgres database connection. Users can manually create their Update tasks or use Leapfrog to create them. This Quick Start Guide covers how to configure Update tasks.
Run Utility: within a Run Utility task, users can choose from a list of Utilities, specify any required parameters, and then add it as a task to incorporate into their Macro's workflow. Please see the AI Agents and Utilities - Overview article for more information on which agents and utilities are available and how to configure them. Actions that can be performed by using the Run Utility task for example include running a macro, duplicating macros & tasks, swapping connections, running geocoding or the integrity checker on a Cosmic Frog model.
Run Macro: run a macro from within the same DataStar project as part of anothe rmacro.
Run AI Agent: within a Run AI Agent task, users can choose from a list of AI Agents, specify any required parameters, and then add it as a task to incorporate into their Macro's workflow. Please see the AI Agents and Utilities - Overview article for more information on which agents and utilities are available and how to configure them. Workflows that can be performed by using the Run AI Agent task for example include profiling and cleansing data, building a Cosmic Frog model, analyzing model outputs and generating a report, and running FTL / LTL / Air Express Freight costing workflows.
Run Machine Learning: there are 4 types of analysis a Run Machine Learning task can do on a set of data: regression, classification, geographic clustering and clustering.
Run Python: execute a Python script as part of the data workflow in a macro.
Solve Model: run Cosmic Frog scenario(s) as part of your workflow.
Users can click on a task in the tasks list and then drag and drop it onto the macro canvas to incorporate it into a macro. Once added to a macro, a task needs to be configured; this will be covered in the next section.
Configuration Tab of a Task
When adding a new task, it needs to be configured, which can be done on the Configuration tab. When a task is newly dropped onto the Macro Canvas its Configuration tab is automatically opened on the right-hand side pane. To make the configuration tab of an already existing task active, click on the task in the Macros tab on the left-hand side pane or click on the task in the Macro Canvas. The configuration options will differ by type of task, here the Configuration tab of an Import task is shown as an example:
We are on the Configuration tab on the right-hand side pane in DataStar.
The type of task is shown here, in this case it is an Import task from the Data Transfer category.
The name of the task can be entered/updated here.
The Data Connection section needs to be configured:
For each section within a task configuration, there is an indicator telling user the status of this section of the configuration. Here the green check mark indicates the Data Connection section of the task configuration has been completed. When this icon is orange, it means the configuration is not yet finished.
Sections within a configuration can be expanded/collapsed by clicking on the down/up caret icon.
Within the Data Connection configuration section, first the Source is specified:
Select the connection that will function as the source for the import task from the drop-down list containing the data connections set up in the project. Cosmic Frog, Postgres database, Excel, and CSV File connections can be used as the source for an Import task. Clicking on the plus icon to the right allows users to create a new data connection from within the task configuration tab.
For data connections with multiple tables (such as a Cosmic Frog model), users can select the table to use as the source from the drop-down list, which also shows how many records each table contains. In our example here, we are using the Shipments connection, which is a CSV file, so the 1 table in this file is used and users do not need to select anything from the drop-down list. Clicking on the grid icon to the right will open the selected table in the central part of DataStar.
Next, the Destination of the import task is configured:
Select the connection that will function as the destination for the import task from the drop-down list. This list will contain the available Postgres database connections (including the Project Sandbox and Cosmic Frog models). Oftentimes, the Project Sandbox will be the destination connection for Import tasks as the imported data will almost always still need to be cleansed, validated, and blended before reaching its final state. Again, the plus icon will let a user create a new data connection.
Data can be imported into either a new or an existing table in the Destination connection. Choose the applicable option from the drop-down.
If "New Table" was selected in the previous step, then enter the name of the new table that will be created in the destination data connection. If "Existing Table" was selected, choose the table to import the data from the Select Table drop-down list. Search, filter, and sort options are available to quickly find the desired table.
If an existing table was chosen as the destination for the import, then the source and destination columns need to be mapped to each other in the Data Mapping section. For more details on the Data Mapping section see this Quick Start Guide.
In the Run Configuration section, the resource size to be used when executing the Macro can be selected. This section is part of the configuration for all task types. Users can select the resource size they want to use for the task from the drop-down list and a link to this Help Center article which explains the different resource sizes is available from within this section too:
Please note that:
The table name is set to RawShipments in the configuration, and it will be imported to the Project Sandbox as a table named rawshipments, so the name is converted to all lowercase.
If there are spaces in the column names in the CSV file, these will be replaced by underscores when importing into the Project Sandbox. Special characters like parentheses in column names are removed. For example a column named Distance (MI) is imported as distance_mi.
The following table provides an overview of what connection type(s) can be used as the source / destination / target connection by which task(s), where PG is short for a PostgreSQL database connection and CF for a Cosmic Frog model connection:
Leapfrog Tab
Leapfrog in DataStar (aka D* AI) is an AI-powered feature that transforms natural language requests into executable DataStar Update and Run SQL tasks. Users can describe what they want to accomplish in plain language, and Leapfrog automatically generates the corresponding task query without requiring technical coding skills or manual inputs for task details. This capability enables both technical and non-technical users to efficiently manipulate data, build Cosmic Frog models, and extract insights through conversational interactions with Leapfrog within DataStar.
Note that there are 2 appendices at the end of this documentation where 1) details around Leapfrog in DataStar's current features & limitations are covered and 2) Leapfrog's data usage and security policies are summarized.
Leapfrog can be accessed by clicking on the “Ask Leapfrog AI” button in the toolbar at the top of DataStar. When you are already in Leapfrog and on the Leapfrog tab, clicking on this button again will start a new conversation.
A panel with two tabs will be opened to the right of the panel that contains the Tasks and Configuration tabs (which will be minimized upon opening Leapfrog):
Previous Leapfrog conversations can be accessed from the Conversations tab.
The current conversation will be shown in the Leapfrog tab, which will by default be the tab that is shown when opening Leapfrog.
The two tabs are by default opened so that 1 of the 2 is shown, and you can switch between them by clicking on the tabs at the top. Clicking on this icon will change the view to a split one, where both tabs are open side-by-side.
To close the Leapfrog panel, click on the cross at the right top.
When starting a new conversation, Leapfrog will show a welcome message with a short description of what it is, what is new in Leapfrog, and links to helpful resources.
This is the prompt writing area, where a user can indicate in natural language what they would like Leapfrog to do. The text prior to typing into the prompt indicates users can type an @ to get help with identifying tables and columns they may want to use in their prompt. This will be shown in screenshots further down in this section.
Once a prompt has been written, click on the send icon to submit it to Leapfrog.
The user has typed and submitted a prompt asking Leapfrog to create unique customers from the destination stores that are present in the rawshipments table (a table in the Project Sandbox) where only shipments between certain dates are to be used. Instructions to average the latitude and longitude are given in order to calculate a latitude and longitude for each customer.
While Leapfrog is working on its response, first a "Leapfrog is on it!" message will be shown, followed by updates summarizing Leapfrog's current internal process step.
The prompt area also indicates that Leapfrog is currently working on a response, so the next prompt cannot yet be submitted. Note however that you can start a new conversation or go back to an existing one and submit a prompt in there. This newly submitted prompt will then be processed in parallel with the earlier submitted prompt. Further below in this section it is explained how a new conversation can be started.
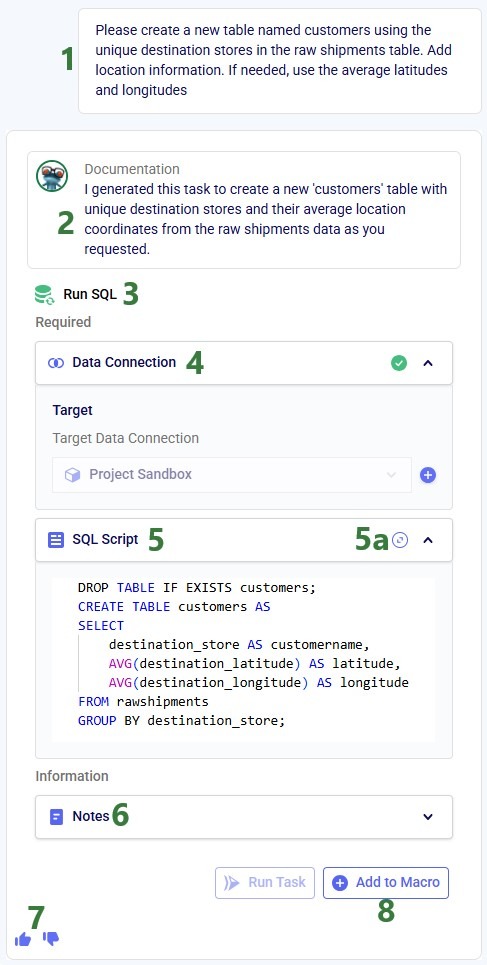
Leapfrog’s response to this prompt is as follows:
The prompt submitted by the user is listed at the top.
Leapfrog first describes in natural language what it has done in response to the prompt in the Documentation box.
It has created a Run SQL task in response to the prompt.
The Data Connection section lists that the target connection is the Project Sandbox.
In the SQL Script section, the SQL query that will be executed if adding this task as a Run SQL task to the macro is shown.
User can click on this expand icon to show the SQL Query in a bigger Code Editor window. The complete SQL Query reads:
DROPTABLE IF Exists customers;
CREATETABLE customers ASSELECT destination_store AS customer,
AVG(destination_latitude) AS latitude,
AVG(destination_longitude) AS longitude
FROM rawshipments
GROUPBY destination_store
The Notes section repeats the contents of the documentation box (see bullet 2 above), with an indication of how long the response took, and a summary of the number of characters and words. This will be added as Notes to the new task if it is is added to the Macro.
Users can provide feedback by clicking on the thumbs-up (positive) or thumbs-down (negative) icons. This way users can indicate if the Leapfrog created task was what they were expecting or not and the AI can be further improved by learning from the feedback.
Clicking on the “Add to Macro” button will add a task with this configuration to the Macro Canvas.
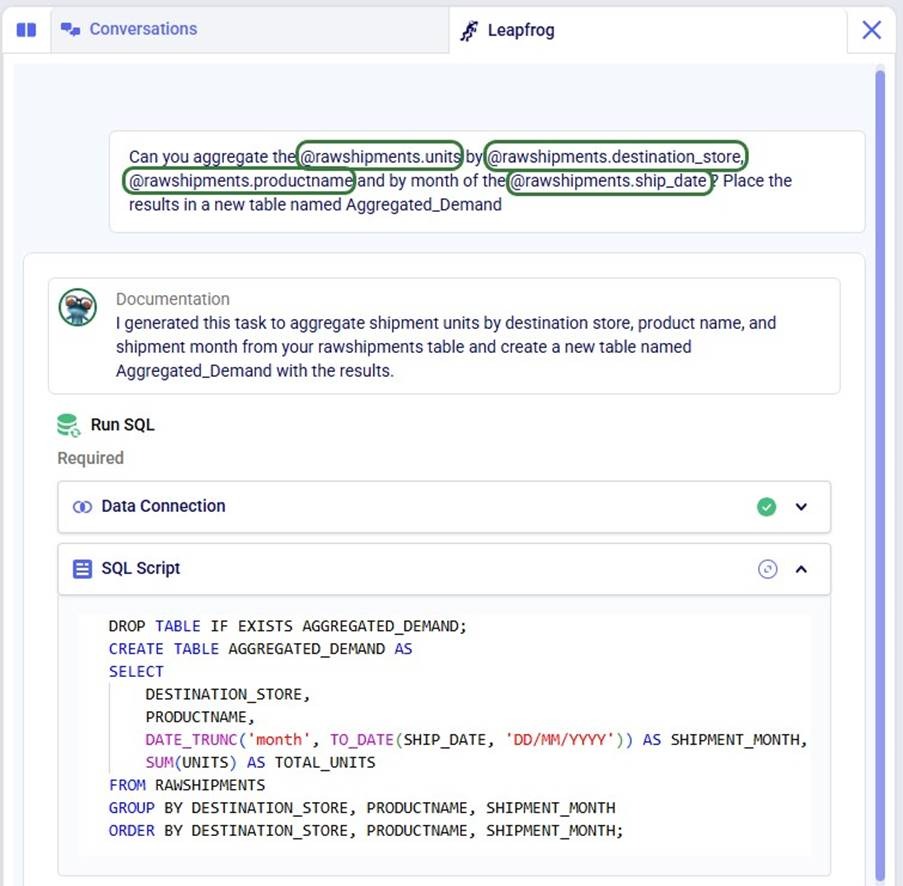
To help users write prompts, the tables present in the Project Sandbox and their columns can be accessed from the prompt writing box by typing an @:
The user has started typing their prompt and uses the @ character to get help with specifying a specific column in a specific table in their project sandbox.
Once the @ has been typed, a list with the tables currently present in the project sandbox comes up.
You can go through this list using the up and down arrow keys on your keyboard or you can click on the table you want to select. Once the table of your choice is selected, you can use the Enter key to close the list. This way you have selected a table without specifying a specific column in it. If you want to select a specific column in the table, use the right arrow key when you are on the table of your choice:
The user has selected the rawshipments table, which is now written in the prompt.
Using the right arrow key, the list has now changed to show the columns present in the rawshipments table.
You can again use the up and down arrow keys to go through the list, and hit the Enter key when on the column you want to select.
This user used the @ functionality repeatedly to write their prompt as follows, which helped to generate their required Run SQL task:
Now, we will also have a look at the Conversations tab while showing the 2 tabs in Split view:
We have clicked on the icon at the top left to change to Split view.
There are 3 Leapfrog conversations here. Clicking on one of them will open it up in the Leapfrog tab on the right-hand side where users can review their prior prompts and Leapfrog responses, add any tasks they had not added yet to their macro, or continue the conversation by submitting follow-up prompts.
Right-clicking on a conversation brings up a context menu with options to: 1) rename the conversation (by default its name is the text of the first prompt in the conversation), and 2) delete the conversation (the user will get a confirmation message before the conversation is deleted).
A Search box is available for users to type text into to quickly filter for conversations containing the search text in their name.
Use the Sort functionality to sort conversations chronologically of when they were created or alphabetically. Clicking again on the same sort option will reverse the order.
The "New Conversation" button can be used to start a new blank conversation.
Within a Leapfrog conversation, Leapfrog remembers the prompts and responses thus far. Users can therefore build upon previous questions, for example by following up with a prompt along the lines of “Like that, but instead of using a cutoff date of August 10, 2025, use September 24, 2025”.
This DataStar Leapfrog Prompt Library contains example prompts which will likely spark ideas on what Leapfrog is capable of and help users get more out of Leapfrog in DataStar.
Running a Macro
Users can run a Macro by selecting it and then clicking on the green Run button at the right top of the DataStar application:
The “Customers from Shipments” macro is open and is also selected in the Macros tab on the left-hand side pane (not shown).
The green Run button is enabled and clicking this will immediately kick off the macro run. Its progress can be monitored in the Macro Logs tab at the bottom of the macro canvas (see also next section) and in the Run Manager application on the Optilogic platform.
Please note that:
If a task is selected in the Macros tab on the left-hand side pane or is selected in the macro canvas by clicking on it, then clicking on the Run button will bring up following message where the user can choose to run the whole macro the task is part of or just the task by itself:
An individual task can also be run by hovering over it or selecting it by clicking on it, and then clicking on the play button that has become visible.
Macros do not need to be complete to be run, it is good practice to run individual tasks and partially completed macros before completely building out a macro without testing it along the way.
When a macro/task is running, the tasks on the macro canvas have visual indicators of the status of the run, while the Macro Logs and Task Logs tabs at the bottom also contain information on the runs, see the next section.
Macro and Task Logs Tabs
Macro Logs
Next, we will cover the Logs tabs at the bottom of the Macro Canvas where logs of macros/tasks that are running/have been run can be found:
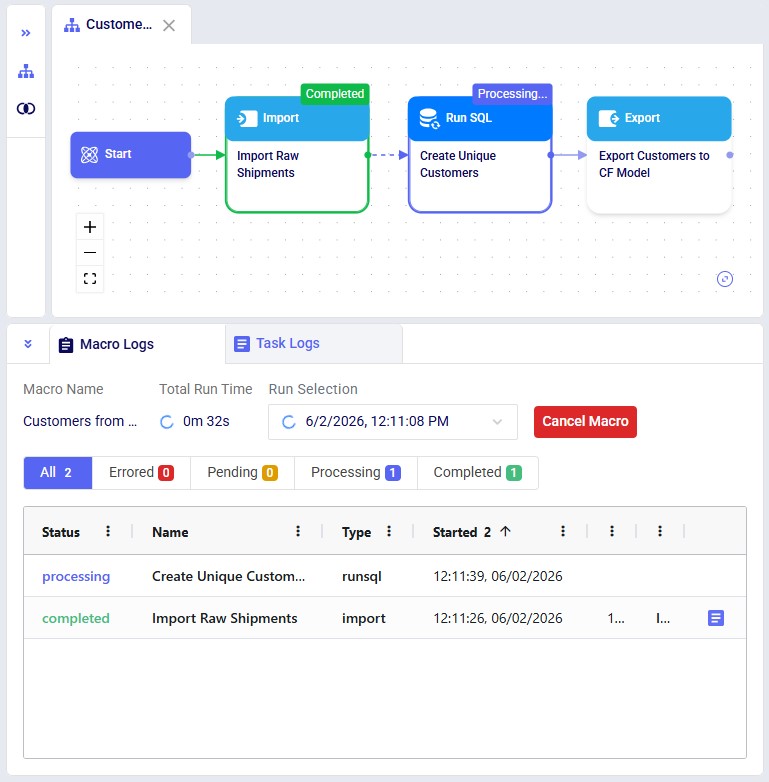
When a macro has not yet been run, the Macro Logs tab will contain a message with a Run button, which can also be used to kick off a macro run. When a macro is running or has been run, the macro log will look similar to the following:
The pane at the bottom of the macro canvas is expanded and we are on the Macro Logs tab.
At the top of the log the name of the macro is listed. If the user switches to a different macro in the macros tab or by clicking on a tab at the top of the macro canvas, the Logs tab will display the logs of that newly selected macro.
The Total Run Time indicates how long the macro ran for (if completed) or has been running for so far (if still processing).
In the Run Selection drop-down, users can switch between looking at the logs of the current macro run and any previous runs of this particular macro.
If a Macro is still running, the Cancel Macro button can be used to abort the run.
The run summary indicates how many of the total number of tasks that were attempted to be run (the "All" number):
Errored - did not run to completion.
Are Blocked - if a task is dependent on preceding task(s), it is blocked until the preceding task(s) have completed successfully.
Are Pending - awaiting to be run.
Are Processing - are currently being executed.
Have Completed - have finished running without any errors.
The macro that was run (Customers from Shipments) has 3 tasks, Import Raw Shipments, Create Unique Customers, and Export Customers to CF Model. We see in these 3 log records that the first task has completed successfully, the second task is pending and should start processing shortly, and the third task is blocked as it is dependent on the second task completing successfully. The type of task, and when the task started and ended are listed too. Should error(s) have occurred, the last one recorded will be listed in the Last Error column.
This grid and its columns can be customized by the user, see the Appendix for details.
The next screenshot shows the log of a run of the same macro where the third task ended in an error:
For the run we are viewing the log for, the status bar indicates that 1 task errored.
Looking at the records in the grid, we see that the third task has status errored.
For this third task the last error that was encountered during the execution of the task is listed in the Last Error column. If the entire error is not visible, you can hover over it and the full text will be shown in a pop-up text box. Reading this last error may help a user pinpoint the problem, but if not, our dedicated support team can most likely help! Feel free to reach out to them on support@optilogic.com.
Please note that:
A log is recorded in the Macro Logs tab while a macro is running, users can watch the real-time updates if the Macro Logs tab is open.
No log is available for a macro that has not yet been run.
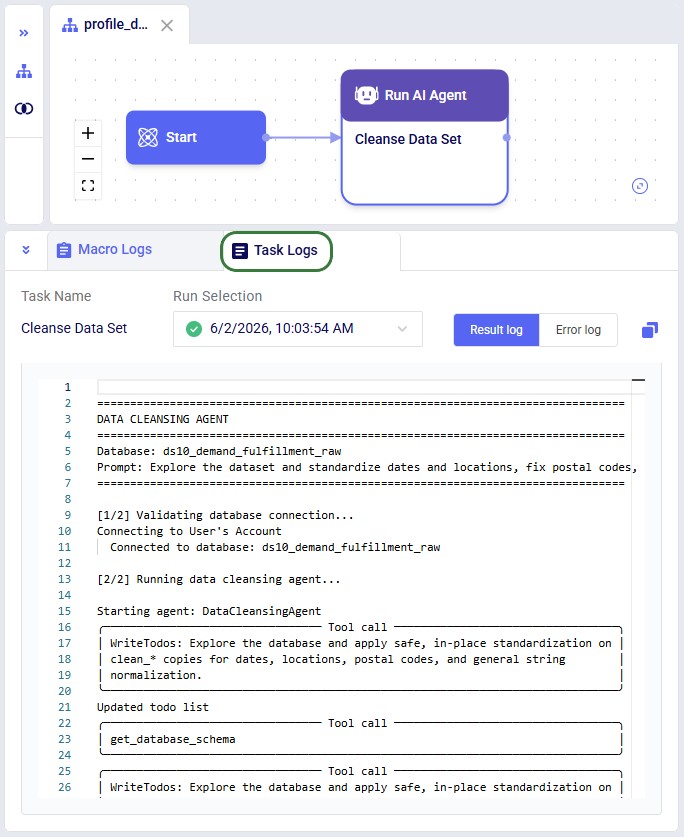
Task Logs
For the following supported tasks a task log is generated when the task is run: Import, Export, Run Utility, Run AI Agent, Run Machine Learning, Run Python, and Solve Model. An example is shown in the next screenshot for a Run AI Agent task using the Data Cleansing AI Agent:
Data Connections Tab
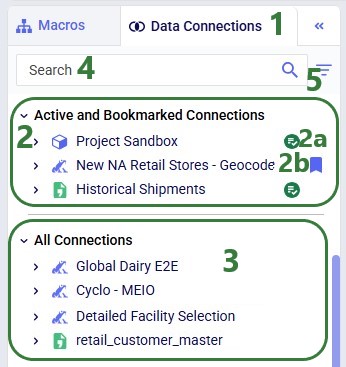
In the Data Connections tab on the left-hand side pane the available data connections are listed:
User has clicked on the Data Connections tab in the left-hand side pane of DataStar to make this the active tab.
In the top part of the connections list, the Active and Bookmarked Connections are listed; by default the list is expanded. Active means the connection is used by 1 or more tasks in any of the macros of the currently open project. Users can manage which connections are bookmarked themselves by adding and removing bookmarks., see also further below in this section on how to do this. Connections can be expanded to view their content (e.g. the tables/views contained in them) by clicking on the caret icon to the left of the connection's name. See the next screenshot for what the connections list looks like when the connections are expanded.
Active connections are indicated with this green checkmark icon.
Bookmarked connections are labeled with this blue icon. Bookmarks are project-based: a bookmarked connection in 1 project is not automatically bookmarked in other DataStar projects.
All other Data Connections currently set up within DataStar are listed in the All Connections list, which is also expanded by default. With the exception of the Project Sandbox, which is unique to each project, all connections are accessible by all DataStar projects.
To quickly find specific connections and/or tables contained in them, users can type into the Search box. Connections and tables with the search text in their names will be filtered out and shown in the list. Please note that for the search to be performed on tables within a data connection, the data connection needs to be expanded (see previous bullet). If the option to not show empty tables is enabled (next bullet), then the search will also not search these empty tables and only return populated tables.
Clicking on the filter icon will bring up 2 options for what is included when showing the contents of connections:
Show Empty Tables - the user can choose to show these in the tables list when the connection is expanded by leaving the checkbox enabled (default) or, alternatively, disable this checkbox so that empty tables are hidden.
Show Views - database connections can have views in them, which are named queries that run on 1 or multiple tables in the database. By default this checkbox is unchecked and views are not shown when a connection is expanded. However, users can choose to show them by enabling this checkbox.
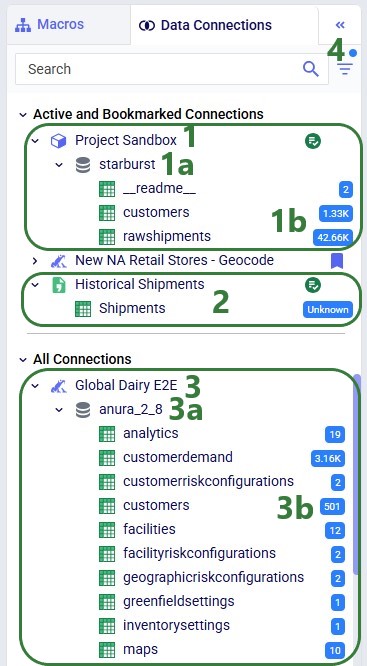
Next, we will have a look at what the connections list looks like when some of the connections have been expanded:
The Project Sandbox connection, which is a Postgres database underneath, has been expanded:
There are multiple schemas present in the Project Sandbox database; the one that contains the tables and will be shown when expanded is the Starburst schema.
We see that there are 2 tables here which have been populated by running the Customers from Shipments macro: the rawshipments table is the result of the Import task ("Import Raw Shipments") in the macro; it has 42.66k records. The customers table is the result of running the Run SQL task ("Create Unique Customers") and this has resulted in 1.33k unique customers.
The Historical Shipments connection is the CSV File data connection connected to the shipments.csv file which contains raw shipment data. Since it is a CSV File connection, it has 1 table in it, which has the same name as the csv file it is connected to (shipments).
This Cosmic Frog model connection is named Global Dairy E2E. Cosmic Frog models are also Postgres databases underneath with a specific schema that Optilogic's Cosmic Frog application uses for optimizations (including network and transportation), simulations (including inventory), and Greenfield runs.
The schema used for the tables in a Cosmic Frog model is called anura_2_8 and this schema is expanded in the connection to view the tables.
In this example, we have chosen not to show empty tables and we see the first 10 populated tables in the list.
In this screenshot, showing empty tables has been turned off using the filter option at the right top of the tab. The blue dot at the right top of the filter icon gives a visual indication that a filter is applied.
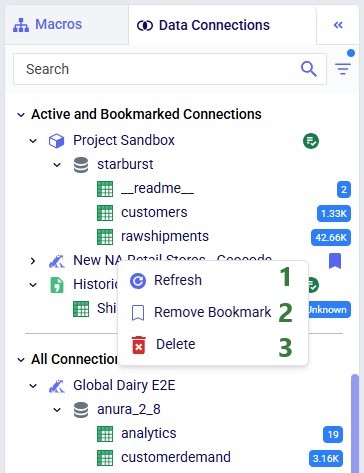
Right-clicking on a connection brings up the following context menu:
Use the Refresh option to view the connection's most recent data.
If a connection is already bookmarked, an option to remove the bookmark is available. For connections that are not bookmarked, the option here is to bookmark the connection.
An option to Delete the connection is available too. This removes the connection from all DataStar projects, also when it is in use (active) in any other project.
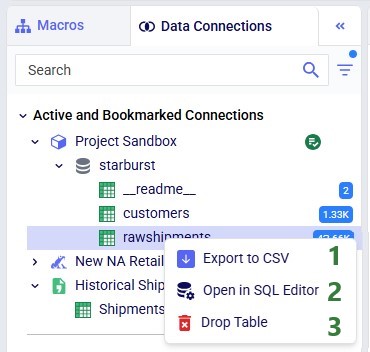
Right-clicking on a table in a connection also brings up a context menu:
Use the Export to CSV option to create a CSV file containing the contents of the table. The CSV file will be available for download from https://optilogic.app/#/user-downloads; a new browser tab with this page will automatically open.
For Cosmic Frog model connections, Postgres database connections, and the Project Sandbox, users have the option to open them in SQL Editor. Clicking on this option opens a new browser tab with the selected database open in SQL Editor.
For tables in the Project Sandbox, users have the option to drop them (remove them). This is especially useful when testing out a macro that is in development: before re-running the updated macro, the user may want to drop any tables the macro creates.
Viewing a Connection's Table
The tables within a connection can be opened within DataStar. They are then displayed in the central part of DataStar where the Macro Canvas is showing when a macro is the active tab.
Please note:
Currently, a data preview of up to 10,000 records for a table is displayed for tables in DataStar. This means that any filtering or sorting done on tables larger than 10k records is done on this subset of 10k records. At the end of this section it is explained how datasets containing more than 10k records per table can be explored by using the SQL Editor application.
Since the Excel data connection is currently in its beta version, data previews are not yet available for it.
A table is opened in the central part of DataStar by clicking on it in the connections list. Here the user clicked on the rawshipments table to open it. The tabs across the top of the central part where the table is now displayed have the name of the table or macro that is open in that tab on them. Users can switch between tables and macros by clicking on the tabs. Currently, the rawshipments table and the "Customers from Shipments" macro are both open, with the rawshipments table being shown since that is the active tab.
At the moment, DataStar will show a preview of up to 10,000 records of any table. The total number of records in the table is also mentioned here. As mentioned above, this also means that any filtering or sorting is performed on this subset of up to 10k records.
An additional menu named Table Functions is available in the toolbar when a table is open in DataStar's central part. Options from this menu are:
Export to CSV - this will export the table to a csv file which will be accessible from user's Downloads area on the Optilogic platform (click on your username at the right top of the screen and select Downloads from the drop-down list). Note to check back in a few minutes if you do not see the download there immediately.
Open in SQL Editor - for databases, this will open the database in the SQL Editor application on the Optilogic platform and show the table that was active in DataStar. A screenshot of a DataStar project sandbox database in SQL Editor and a link to a Help Center article on the SQL Editor application are included at the end of this section.
This grid can be customized by the user (e.g. sort and change the order of columns), see the appendix on how to do this.
Users can also filter the grid based on values in one or multiple columns. The next screenshot covers this in more detail.
On the right-hand side, there are 2 panes available that will become visible when clicking on their names: 1) Columns: to configure which columns are shown in the grid and in which order, and 2) Filters: filters can also be configured from this fold out pane. Each of these are covered in a screenshot further below in this section. Once a pane has been opened, it can be closed again by clicking on its name on the right-hand side of the pane once more.
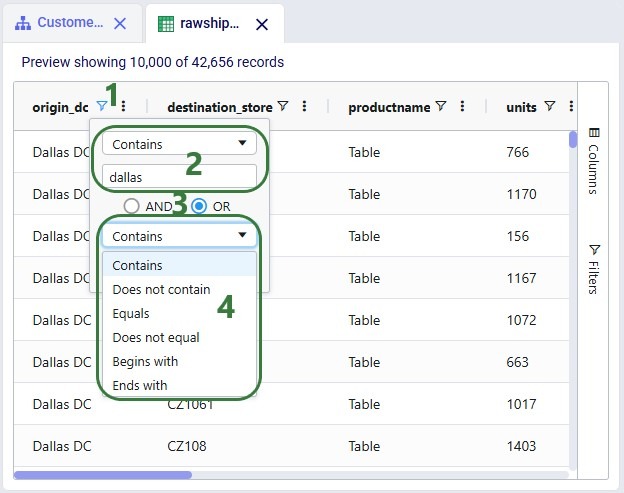
A table can be filtered based on values in one or multiple columns:
A column that has been filtered can be recognized by the blue filter icon to the right of the column name. This filter icon is black when not filtering on this column. Clicking on the filter icon brings up a form where filters can be configured.
Currently, the origin_dc field is filtered for records where the value contains the text "dallas". This is non-case sensitive and all records that have "dallas" in their name (whether at the start, at the end or somewhere in between) will be filtered out and shown. Please note that:
Once a user hits the Enter key after typing into the Filter... text box, the filter is applied.
To remove a filter, users need to delete the text from the Filter... text box.
A filter can consist of multiple parts and whether only records that satisfy all filter parts are shown or records that satisfy at least one of the parts are shown depends on the selection of "AND" vs "OR" here. When using AND, only records that satisfy all filter parts will be shown. When using OR, records that satisfy at least one of the filter parts will be shown.
Besides filtering records for their values containing certain text (see bullet 2 above), there are additional options available as shown in this drop-down list. After selecting the desired option, user can type in the Filter... text box (not visible in the above screenshot as it is covered by the filter type drop-down list). The drop-down list shown in the above screenshot is for columns of string/text data type. Different options are available for columns containing numerical data, as shown here for the Units column:
Columns can be re-ordered and hidden/shown as described in the Appendix; this can be done using the Columns fold-out pane too:
Click on Columns on the right-hand side of the table to open the Columns pane.
To find the column(s) of interest quickly, users can type into the Search... text box to filter the list of columns down to those containing the typed text in their name.
These checkboxes are used to hide/show columns in the grid: uncheck a column's checkbox to hide it. Note that the checkbox at the top of the list can be used to hide/show all columns with one click.
The order of the columns in the grid can be changed by clicking on the icon with 4x3 dots, then hold the mouse down and drag the column up or down. Let go of the mouse once the column is in the desired position.
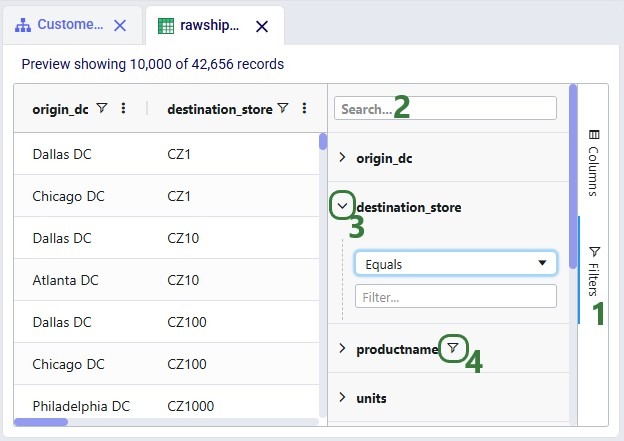
Finally, filters can also be configured from a fold-out pane:
Click on Filters on the right-hand side of the table to open the Filters pane.
To find the column(s) you want to filter on quickly, you can type into the Search... text box to filter the list of columns down to those containing the typed text in their name.
Click on the caret icon to the left of the column name that you want to apply the filter to so that it expands and the filter configuration for the column becomes visible. Configure the filter as covered above by selecting the filter type from the drop-down and typing the filter criterion into the Filter... text box.
A column that has a filter applied to it already can be recognized in the list: it has a filter icon to the right of its column name whereas unfiltered columns have no such icon displayed.
Users can explore the complete dataset of connections with tables larger than 10k records in other applications on the Optilogic platform, depending on the type of connection:
Lightning Editor: for CSV files
SQL Editor: for Postgres DB connections, which includes the Project Sandbox and Cosmic Frog models. See this SQL Editor Overview help center article on how to use the SQL Editor. For the Project Sandbox, please note that:
The name of the Project Sandbox database is the same as the project name
The tables that are created in the sandbox can be found under the “starburst” schema
Here is how to find the database and table(s) of interest in SQL Editor:
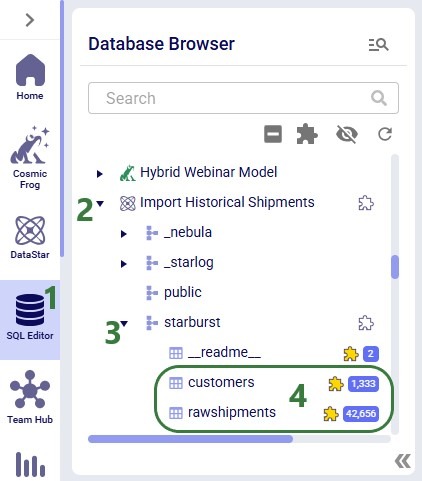
When logged into the Optilogic platform, click on the SQL Editor icon in the list of available applications on the left-hand side to open it. Your SQL Editor icon may be in a different location in the list, and if it is not visible at all, then click on the icon with 3 horizontal dots to show any applications that are not shown currently.
Either use the Search box at the top to find your database of interest or scroll through the list. DataStar project sandbox databases can be recognized by the DataStar logo to the left of the database name. The name of a DataStar project sandbox database is that of the DataStar project it belongs, in our example "Import Historical Shipments".
When expanding the database, the starburst schema which contains the tables contained in the data connection will by default be expanded too.
We see the customers and raswhipments tables that were the result of running the Customers from Shipments macro. Clicking on a table will run a query to show the first 20 records of that table.
Helpful Resources
Here are a few additional links that may be helpful:
Additional DataStar documentation on Optilogic's Help Center can be found in this Navigating DataStar section.
We hope you are as excited about starting to work with DataStar as we are! Please stay tuned for regular updates to both DataStar and all the accompanying documentation. As always, for any questions or feedback, feel free to contact our support team at support@optilogic.com.
Appendix - Customizing Grids
The grids used in DataStar can be customized and we will cover the options available through the screenshot below. This screenshot is of the list of CSV files in user's Optilogic account when creating a new CSV File connection. The same grid options are available on the grid in the Logs tab and when viewing tables that are part of any Data Connections in the central part of DataStar.
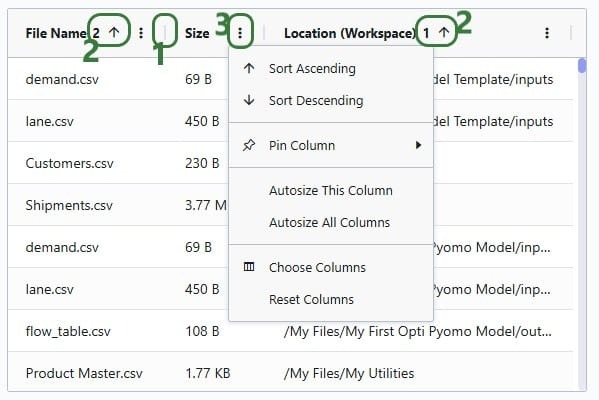
The columns in the grid can be dragged to change the order of the columns, and they can also be resized by clicking on the vertical bar in between the columns (the mouse then changes to 2 arrows pointing away from each other), holding the mouse down and moving right or left. Double-clicking while hovering over the vertical bar (mouse has changed to 2 arrows pointing away from each other) will autosize the column to fit the longest value.
The grid can be sorted by the values of a column by clicking on its column name; this will sort the column in ascending order. Clicking on the column name will change the sort to be in descending order and clicking a third time takes the sort off the column. Sorting by multiple columns is possible too: sort the first column as desired, then hold down the Ctrl and Shift keys while clicking on the name(s) of a second, third, etc. column to add them to the multi-sort. Numbers indicate the order of the sort. Here, the grid was first sorted by the Location column and then by File Name.
Clicking on the icon with 3 vertical dots to the right of a column name will bring up a context menu with the following options:
Sort Ascending / Sort Descending / Clear Sort: depending on if the column is sorted and if so, how, 2 of these 3 options will be listed for each column to quickly change / take off the sort on this column.
Pin Column: columns can be put in a fixed position that will stay visible when scrolling. Options are to pin the column all the way to the left or all the way to the right of the grid.
Autosize This column: change the width of the column to fit the longest value.
Autosize All Columns: change the width of all columns in the grid to fit their longest values.
Choose Columns: brings up the list of columns present in the grid with the options to 1) hide them by unchecking their checkboxes and / or 2) change the column order by dragging columns to different positions in the list.
Reset Columns: unhides all columns if any are hidden and puts them in their original order.
Appendix - Leapfrog Features & Limitations
Current Version Features:
Text to SQL generation capabilities through Run SQL and Update tasks. Currently, the following types of SQL queries are supported:
Insert
Update
Delete
Drop Table
Create Table
Alter Table
Union
Supported data connections: Project Sandbox (Starburst schema) relevant to the DataStar project. Use the @ character in prompts to let Leapfrog help you with the table and column names.
Output formats - each prompt response typically contains:
Description on what Leapfrog creates in the Documentation part
Run SQL or Update task
Add to Macro option
Notes section which repeats the documentation text, plus an indication of how long the response took, and the number of characters and words. This becomes the Notes section of the task if it is added to the macro.
Multi-turn conversation: Leapfrog has a ‘memory’ within each conversation. This means users can reference a previous prompt or response in a subsequent request.
Conversation history is kept and user can go back to previous conversations to for example add any tasks to a macro that were not added yet or continue a conversation from where it was left off.
Multiple conversations can be working on a prompt response simultaneously.
Multi-language support: users can submit their prompt in languages other than English, and the Documentation part of the response will be in the same language.
Current Limitations
Each task created from Leapfrog can only use 1 connection at a time, and this connection is the Project Sandbox (Starburst). Moving data from one connection to another is not yet supported.
Leapfrog in DataStar cannot answer questions about its own capabilities yet.
Appendix - Leapfrog Data Usage & Security
Training Data
Leapfrog's brainpower comes from:
Optilogic's Anura schema
Hundreds of handcrafted SQL examples from real supply chain experts
All training processes are owned and managed by Optilogic — no outside data is used.
Using Leapfrog
When you ask Leapfrog a question:
It securely accesses your data through an API.
Your data stays yours — no external sharing or external training.
Conversation History
Your conversations (prompts, answers, feedback) are stored securely at the user level.
Only you and authorized Optilogic personnel can view your history.
Other users cannot access your data.
Privacy and Ownership
You retain full ownership of your model data. Only authorized Optilogic personnel can access it.
Optilogic uses industry-standard security protocols to keep everything safe and sound.
DataStar is Optilogic’s new AI-powered data product designed to help supply chain teams build and update models & scenarios and power apps faster & easier than ever before. It enables users to create flexible, accessible, and repeatable workflows with zero learning curve—combining drag-and-drop simplicity, natural language AI, and deep supply chain context.
Today, up to an estimated 80% of a modeler's time is spent on data—connecting, cleaning, transforming, validating, and integrating it to build or refresh models. DataStar drastically shrinks that time, enabling teams to:
Answer more questions faster
Unlock repeatable value across business review
Focus on strategic decisions, not data wrangling
The 2 main goals of DataStar are 1) ease of use, and 2) effortless collaboration, these are achieved by:
Providing AI-powered, no-code automation with deep supply chain context
Supporting drag-and-drop workflows, natural language commands, and advanced scripting (SQL/Python)
Full integration into the Optilogic platform: users can prep data, trigger model & scenario runs, and push insights to apps or dashboards
Enabling scalable, collaborative, cloud-native modeling for repeatable decision-making at speed
In this documentation, we will start with a high-level overview of the DataStar building blocks. Next, creating projects and data connections will be covered before diving into the details of adding tasks and chaining them together into macros, which can then be run to accomplish the data goals of your project.
Before diving into more details in later sections, this section will describe the main building blocks of DataStar, which include Data Connections, Projects, Macros, and Tasks.
Data Connections
Since DataStar is all about working with data, Data Connections are an important part of DataStar. These enable users to quickly connect to and pull in data from a range of data sources. Data Connections in DataStar:
Are global to the DataStar application – meaning each project within DataStar can use any of the data sources that have been set up as Data Connections.
Can also be set up from within a DataStar project – they then become available for use in other DataStar projects too.
Can be of the following types currently:
Postgres – an open-source relational database management system that supports both SQL and JSON querying
CSV Files – files containing data in the comma separated values format, which can be created by and opened in Excel
Cosmic Frog Models – a Cosmic Frog model which is a Postgres database using a specific data schema called Anura. Often the projects in DataStar will populate Cosmic Frog model input tables to build complete models that are ready to be run by one of the Cosmic Frog engines and/or read in Cosmic Frog output tables for output analysis
Excel – spreadsheet editor developed by Microsoft for Windows (beta version)
Connections to other common data resources such as MySQL, OneDrive, SAP, and Snowflake will become available as built-in connection types over time. Currently, these data sources can be connected to by using scripts that pull them in from the Optilogic side or using ETL tools or automation platforms that push data onto the Optilogic platform. Please see the "DataStar: Data Integration" article for more details on working with both local and external data sources.
Users can check the Resource Library for the currently available template scripts and utilities. These can be copied to your account or downloaded and after a few updates around credentials, etc. you will be able to start pulling data in from external sources:
Go to the Resource Library application while logged in on the Optilogic platform.
Click on the DataStar button at the right top to filter the list of resources for those specific to DataStar.
Optionally, use the Tags drop-down to filter the list further down to find what you are looking for quickly. Here we have selected 2 tags: "Extensibility Tool" and "Utility".
Browse the list and click on a resource of interest to select it, here we clicked on the "Google Big Query Insert Script" resource.
After clicking on it, a description of the resource appears on the right hand-side.
Associated files can be downloaded by using these Download buttons.
The blue buttons at the right bottom can be used to gain access to this resource. Click on the Copy to Account button to start using the resource on the Optilogic platform. Scripts can for example be viewed, edited, and run in the Lightning Editor application.
Projects, Macros, and Tasks
Projects are the main container of work within DataStar. Typically, a Project will aim to achieve a certain goal by performing all or a subset of importing specific data, then cleansing, transforming & blending it, and finally publishing the results to another file/database. The scope of DataStar Projects can vary greatly, think for example of following 2 examples:
Cleanse and filter a specific set of historical supply chain data.
Build a Cosmic Frog model from scratch using the raw data from your data sources, then run the model, analyze its outputs, and finally generate reports at the desired level of aggregation.
Projects consist of one or multiple macros which in turn consist of 1 or multiple tasks. Tasks are the individual actions or steps which can be chained together within a macro to accomplish a specific goal.
The next screenshot shows an example Macro called "Transportation Policies" which consists of 8 individual tasks that are chained together to create transportation policies for a Cosmic Frog model from imported Shipments and Costs data:
Project Sandbox
Every project by default contains a Data Connection named Project Sandbox. This data connection is not global to all DataStar projects; it is specific to the project it is part of. The Project Sandbox is a Postgres database where users generally import the raw data from the other data connections into, perform transformations in, save intermediate states of data in, and then publish the results out to a Cosmic Frog model (which is a data connection different than the Project Sandbox connection). It is also possible that some of the data in the Project Sandbox is the final result/deliverable of the DataStar Project or that the results are published into a different type of file or system that is set up as a data connection rather than into a Cosmic Frog model.
How Data Connections, Projects, and Macros Relate to Each Other
The next diagram shows how Data Connections, Projects, and Macros relate to each other in DataStar:
In this example, there are 7 Data Connections configured in DataStar, see the rectangle with green background on the left:
An Excel connection called Historical Data
A Postgres database connection called Enterprise Data
An Excel connection called Location Data
A CSV connection called Cost Data
A CSV connection called Capacity Data
A Cosmic Frog connection called Neo NA Model
A Cosmic Frog connection called Global Model
Note that the 2 Cosmic Frog connections displayed here on the right-hand side are the same 2 as shown in the list on the left, they are just repeated in the diagram to facilitate explaining the flow of data.
There are 2 projects set up in DataStar, see the 2 rectangles with blue background in the middle:
Project 1 creates Policies tables for the Cosmic Frog model named Neo NA Model, a network optimization model in the Northern Americas geography.
Project 2 builds, runs, and analyzes a complete Cosmic Frog model named Global Model from raw data.
Looking at Project 1, we see that:
It uses 3 of the 7 Data Connections available (blue arrows):
Two to pull data in from: the Historical Data, and Cost Data connections.
One to publish data into: the Neo NA Model.
It has its own Project Sandbox as an additional Data Connection which is specific to this project only.
It contains 3 macros: Shipments, Production, and Inventory. The Shipments macro can look similar to the example one seen in the previous screenshot.
The 3 macros pull data from the Historical Data, Cost Data, and Project Sandbox connections.
The 3 macros publish data into the Project Sandbox and the Neo NA model connections. The completed Transportation Policies, Production Policies, and Inventory Policies tables are published into the Cosmic Frog model.
Similarly, looking at Project 2, we follow the yellow arrows to understand which Data Connections are used to pull data from and publish data into. Note that the Global Model connection is used to publish results into by the “Publish to Model” macro which populates the model’s input tables and it is also used as a connection to pull data from for the “Output Analysis” macro after the model has run to completion.
As referenced above too, to learn more about working with both local and external data, please see this "DataStar: Data Integration" article.
Creating Projects & Data Connections
On the start page of DataStar, the user will be shown their existing projects and data connections. They can be opened, or deleted here, and users also have the ability to create new projects and data connections from this start page.
How to Create a New Project
The next screenshot shows the existing projects in card format:
When logged into the Optilogic platform, click on the DataStar icon in the list of available applications on the left-hand side to open DataStar. Your DataStar icon may be in a different location in the list, and if it is not visible at all, then click on the icon with 3 horizontal dots to show any applications that are not shown currently.
We are on the Projects tab of the start page in the DataStar application.
The projects are shown in card format (the left icon); the other option is to show them as a list (the right icon).
When hovering over a project, the options to edit the project (rename it and/or update its description) and to delete the project become visible. When clicking on the delete project icon, a message asking the user to confirm they want to delete the project comes up before actually deleting it.
Users can quickly search the list of projects by typing in the Search text box and projects containing the text will be filtered out.
New projects can be created by clicking on the Create Project button in the toolbar at the top of the DataStar application:
The user clicked on the Create Project button which opened the Create Project form.
Here, a Project Name can be entered.
Optionally, a Project Description can be added.
Under Project Type, users can either create a new Empty Project or choose to create a Project from Template. Here, we select the Empty Project option; Template Proejects are discussed in the next section.
Click on the Edit button to change the project’s appearance by choosing an icon and color.
Click on the Add Project button to create the project.
Note that on the right-hand side, Help for the currently open DataStar form is shown.
If at any point during the creation of a new project the user decides they do not want to go ahead with it, they can close the form by either clicking on the back icon at the left top or the cross icon at the right top.
Using Template Projects
If on the Create Project form a user decides they want to use a Template Project rather than a new Empty Project, it works as follows:
The Project from Template option has been chosen on the Create Project form.
This brings up a list of available template projects users can choose from. Hovering over a template project will bring up a textbox with a short description of the template project.
Click on a template project to select it, it will then be greyed out and unavailable to select again. In addition:
The template project will be pinned to the top of the list with a darker background to indicate that this is the currently selected template project.
The project name will be automatically filled out with the name of the selected template project.
Users can choose to add an optional description.
When a template project is selected, information about it will be shown on the right-hand side of the Create Project form.
A preview of detailed documentation of the template project is shown too. Options for zooming, downloading and printing are available for this documentation; click on the icon with 3 vertical dots to see all options.
Like with new empty projects, the icon and background color for the template project can be edited by clicking on the Edit button.
Click on Add Project to make the project available from within DataStar. It will now appear on the Projects tab on DataStar's start page.
These template projects are also available on Optilogic's Resource Library:
Go to the Resource Library application while logged in on the Optilogic platform.
Click on the DataStar button at the right top to filter the list of resources for those specific to DataStar.
Use the Tags drop-down to filter the list further down to those that are tagged with "Project".
Browse the list and click on a project of interest, here we clicked on the "Detect and Report Outliers" resource.
After clicking on it, a description of the resource appears on the right hand-side.
Associated files can be downloaded, a script and documentation in PDF format are available for download for this resource.
The blue buttons at the right bottom can be used to gain access to this resource. Click on the Copy to Account button to start using this project in DataStar.
After the copy process completes, we can see the project appear in the Explorer and in the Project list in DataStar:
We have expanded the Explorer application to see the files and folders in our Optilogic account.
Under /My Files/DataStar, a new folder "Profile and Cleanse Data" was created. It contains 1 file with a .dstar extension, this is a DataStar project database (underneath a Postrges database).
In the central part of the platform DataStar is the active application as that is the one selected in the list of applications.
We are on the Projects tab on the start page in DataStar.
The list of projects is shown in list format here where the most recent project is shown at the top of the list. This is the "Profile and Cleanse Data" project we just copied from the Resource Library. Click on it to open it and start exploring.
Note that any files needed for data connections in template projects copied from the Resource Library can be found under the "Sent to Me" folder in the Explorer. They will be in a subfolder named @datastartemplateprojects#optilogic (the sender of the files).
How to Create a New Data Connection
The next screenshot shows the Data Connections that have already been set up in DataStar in list view:
We are on the Data Connections tab of the start page in the DataStar application.
The Data Connections are shown in list format (right icon); the other option is to show them in card format (left icon) similar to the screenshot above of the Projects in card format.
For each Data Connection we see the following details in the list: Name, Connection Type, Description, Created At, Owner, Last Edited, and Actions. Clicking on the column headers sorts the table by that column in ascending order, clicking again will sort in descending order, and clicking a third time takes the sort off. Holding both the Shift and Ctrl buttons down and next clicking on multiple column headers will sort the table by those multiple columns.
Note that when hovering over the Actions field in a data connection row, icons to rename and delete the connection become visible. When users click on the delete icon, a message asking the user to confirm they want to delete the data connection comes up before actually deleting it.
Users can quickly search the list of data connections by typing in the Search text box and connections containing the text will be filtered out.
New data connections can be created by clicking on the Create Data Connection button in the toolbar at the top of the DataStar application:
The Create Data Connection form has been opened by clicking on the Create Data Connection button.
First, a Data Connection Name needs to be entered.
Optionally, the user can write a Connection Description.
The type of connection can be chosen from the Connection Type drop-down list. See the “Data Connections” section further above for a full list of connection types and a short description of each.
The remainder of the Create Data Connection form will change depending on the type of connection that was chosen as different types of connections require different inputs (e.g. host, port, server, schema, etc.). In our example, the user chooses CSV Files as the connection type:
The Connection Type is now showing CSV Files per the selection user made.
There are 2 options to select the CSV source file:
The CSV file to be used for the Data Connection can be dragged and dropped onto this “Drag and drop” area from user’s computer. It will then be uploaded to the user’s /MyFiles/DataStar folder on the Optilogic platform. In case a file of the same name already exists in that location, it will be overwritten.
The user can browse the list of CSV files that exist in their Optilogic account already (not limited to files under /MyFiles/DataStar, will show all CSV files in their account) to select one as the source for the data connection. Note that:
We can quickly find files of interest by typing in the Search box at the top of the list to filter out any files containing the typed text in their names.
In case not all 3 columns shown in the screenshot are visible, users can scroll right to also see the location in user’s Optilogic workspace of the file.
Options to customize the grid to users' needs (e.g. sorting, changing the order of columns, etc.) are explained in the Appendix.
After selecting the CSV file to be used for the Data Connection, users can optionally configure the data connection further with the options provided on the right-hand side of the form. See the CSV File Data Connection help center article for more details on these configuration options. Once done configuring the data connection, click on the Add Connection button to create the new data connection.
In our walk-through here, the user drags and drops a Shipments.csv file from their local computer on top of the Drag and drop area:
The user dragged and dropped their local Shipments.csv file onto the “Drag and drop” area.
Once the upload of the file is finished, a message in green font indicating the upload completed successfully is shown.
The Shipments.csv file is now listed in the list of CSV files the user has available in their Optilogic account. As expected, the location of this file is /MyFiles/DataStar. When clicking on the file in the list to select it, it becomes greyed out to indicate it is already selected.
The selected file will be pinned to the top of the list, to prevent the user having to scroll through the list to find the currently selected file.
The user can optionally configure any of the options provided on the right-hand side of the form, and then click on the Add Data Connection button to create the connection.
Inside a DataStar Project
Now let us look at a project when it is open in DataStar. We will first get a lay of the land with a high-level overview screenshot and then go into more detail for the different parts of the DataStar user interface:
At the top of the DataStar application, users will find a toolbar, which contains following options from left to right:
Clicking on the back button all the way to the left will take user back to DataStar’s start page where the lists of existing projects and data connections are shown, see also the previous section “Creating Projects & Data Connections”.
Create Macro button: click on this button to create a new Macro.
Create Data Connection button: click on this button to create a new Data Connection.
Table Functions drop-down menu. When a table from a data connection is open in DataStar, this menu will become available and allows a user to export the table to CSV or open it in the SQL Editor application on the Optilogic platform. See also the "Viewing a Connection's Table" section further below.
Manage Variables button: in future, this button will be enabled so users can pass in values that can be used/updated in their macros.
Ask Leapfrog AI button: this opens the Leapfrog window. Start or continue a conversation with Leapfrog here. Use natural language prompts and Leapfrog will configure Update and Run SQL tasks for you! See the Leapfrog section further below for more details.
The Run button is used to start any task or macro runs.
In the pane on the left-hand side of the application, either the list of Macros that the project contains (left tab) or the list of available Data Connections (right tab) is shown. In this screenshot, the Macros tab is the active tab.
Macros can be expanded/collapsed; when expanded you see a list of all the tasks/macros that make up the macro. This will be shown in more detail below.
Likewise, data connections can also be expanded/collapsed; when expanded you see the available schemas for database connections and (for all connection types) the tables contained in the data connection.
In the pane on the right-hand side of the application, there are 2 tabs:
Tasks – from here tasks can be chosen and dragged and dropped onto the Macro Canvas (the central part of the DataStar application) to add them to the currently active macro.
Configuration – the specific configuration parameters for the currently selected task can be set or updated here.
The central part of DataStar is called the Macro Canvas. Tasks can be dragged and dropped onto here and then connected to each other to build out a macro that will accomplish a specific data process. The macro canvas becomes active when the user clicks on a macro or one of its tasks in the Macros tab on the left. The macro name is also listed in the tab at the top of the canvas.
Tables present in any of the Data Connections can also be shown in the central part of DataStar by clicking on them in the Data Connections tab. This shows as an additional tab across the top of the macro canvas. Multiple macros and tables can be opened here at the same time, and users can switch between them by clicking on the tab of the macro/table they wish to show.
Logs – the Macro Logs and Task Logs tabs are located at the bottom of the Macro Canvas. Here macro and individual task runs are tracked: which task was run when and did it complete successfully. When using Run AI Agent and Run Utility tasks, Agent & Utility steps, findings, and feedback can be found in the Task Log.
The 3 panes on the left-hand side, right-hand side, and to the bottom of the Macro Canvas can all be collapsed and expanded as desired. This can be done by clicking on the icons with the double caret symbol.
Macros Tab
Next, we will dive a bit deeper into a macro:
The macro named “Customers from Shipments” is selected on the Macros tab on the left-hand side panel of DataStar. Clicking on a macro in the Macros tab will also open it in the macro canvas.
The macro has been expanded, so we see the list of tasks that are part of this macro. Users will note that:
By default, each macro has a task named Start, which has its own specific icon and blue color. This task cannot be removed or renamed and the first actual task of the macro will be connected to it.
Tasks from the Data Transfer category have light blue icons associated with them, and those from the Automate & Execute category are green. The icon itself also indicates the type of task it is. For example, the “Import Raw Shipments” task is an Import task from the Data Transfer category, and the “Create Unique Customers” task is a Run SQL task from the Automate & Execute category.
Right-clicking on a Macro or a Task will bring up a context menu which can be used to Rename or Delete the Macro or Task. For tasks there is the extra option of Zoom to Task which will re-position the macro on the Macro Canvas such that this task is in the center.
Use the Search text box to quickly find a macro/task whose name contains the typed text.
This button can be used to expand or collapse all macros with one click.
Click on the Create Macro button in the toolbar to add a new Macro to the project.
Macro Canvas
The Macro Canvas for the Transportation Policies macro is shown in the following screenshot:
The tab tells us which macro we are looking at. Note that multiple macros/connection tables can be opened here in multiple tabs and users can easily switch between them by clicking on the tab of the desired macro/table.
The canvas currently shows 5 of the tasks that are part of the "Transportation Policies" macro. The bottom part of a task contains the name and the top colored part of a task shows what type of task it is. For example:
The task at the top connected to Start is an Import task ; its name is “Import Shipments”.
The task to the right of the "Import Shipments" task is a Delete task ; its name is “Delete Shipments before 2025”.
Tasks can be dragged and dropped onto the canvas from the Tasks list in the right-hand side pane. When hovering over the canvas, DataStar will suggest which task to chain the new task to based on proximity. If the task is dropped, it will automatically be connected to this suggested task. If the task is dropped onto the canvas without connecting to a task, the user can manually connect tasks by clicking in the middle of the right edge of the first task, holding the mouse down, and then clicking in the middle of the left edge of the next task. Please note that:
DataStar helps users by showing a bigger circle when hovering over the middle of a left or right edge of a task.
Tasks can be connected to multiple other tasks. If there are for example 2 tasks connected to a third task that succeeds the first 2, then this third task will not execute until both preceding tasks have completed.
To delete a line that connects 2 tasks: click on the line (it will then become a dotted line), and then hit the Delete or Backspace key. Alternatively, right-click on the line and select Delete from the context menu that comes up.
In the left bottom corner of the canvas users have access to the following controls, from top to bottom:
Zoom in: clicking on this plus icon will increase the size of the tasks on the canvas, less of the total macro will be visible.
Zoom out: clicking on this minus icon will decrease the size of the tasks on the canvas, more of the total macro will be visible.
Fit view: clicking on the icon with 4 square corners will set the position and zoom-level of the canvas such that all tasks that are part of the macro will be shown on the canvas, using up as much of the canvas space as possible.
The grey rectangle at the right bottom of the canvas is the "Mini Map", it shows a small diagram of where all the tasks that are part of the macro are positioned. The smaller white rectangle within this grey rectangle indicates which part of the entire macro the canvas is showing currently. This is helpful when you have a macro with many tasks and you want to pan through it while it is zoomed in.
In addition to the above, please note following regarding the Macro Canvas:
Users can position the canvas as they desire by clicking on it, holding the mouse down and then moving the mouse to drag the canvas in any direction.
Users can also zoom in/out on the canvas by using the mouse or 2 fingers on a trackpad (move closer to each other to zoom out and move further apart to zoom in).
Clicking on a task in the canvas does several things:
Selects the task (i.e. highlights it) in the macro(s) it is part of in the Macros tab on the left-hand side pane.
Opens the Configuration of the task in the right-hand side pane.
Hovering over a task will make Run Task, Dupplicate Task and Delete icons visible:
When clicking on the Run Task icon, the task is run by itself immediately. Its progress can be monitored in the Task Logs tab at the bottom of the macro canvas and in the Run Manager application on the Optilogic platform.
Use Duplicate task to create an exact copy of the task in the same macro. The name of the copied task will be the original task's name appended with (1), (2), etc.
After clicking on the Delete Task icon, a confirmation message to ensure the user wants to delete the task will come up first before the task is removed.
Tasks Tab
We will move on to covering the 2 tabs on the right-hand side pane, starting with the Tasks tab. Keep in mind that in the descriptions of the tasks below, the Project Sandbox is a Postgres database connection. The following tasks are currently available:
From top to bottom:
Import: import data from one data source into another. Data can be imported from a CSV, Excel, Cosmic Frog or Postgres database connection (in this case this does not include the Project Sandbox) into a Cosmic Frog or Postgres database connection. Typically used to import data from other connections into the Project Sandbox. This Quick Start Guide shows the Import task in action.
Export: export data from one data source into another. Data can be exported from a Cosmic Frog or Postgres database connection to another Cosmic Frog or Postgres database connection or to a CSV-file. Typically used to export data from the Project Sandbox into the connection that will hold the result of the DataStar workflow, such as a Cosmic Frog model. An example of using the Export task is shown in this Quick Start Guide.
Select: create a new table from a subset of columns and/or rows from one or multiple tables in a data connection, subject to easily configurable no-code joins and conditions.
Group By: create a new table by aggregating data from 1 or multiple tables in a data connection, subject to easily configurable no-code joins, grouping & aggregation statements, and optional pre- and post-aggreation conditions.
Run SQL: perform SQL queries on data in Cosmic Frog or Postgres database connections. Users can manually create their RunSQL tasks or use Leapfrog to create them. For the latter, please see this Quick Start Guide for more details.
Delete: delete all or a subset of records from a table in a Cosmic Frog or Postgres database connection.
Update: modify data in a table in a Cosmic Frog or Postgres database connection. Users can manually create their Update tasks or use Leapfrog to create them. This Quick Start Guide covers how to configure Update tasks.
Run Utility: within a Run Utility task, users can choose from a list of Utilities, specify any required parameters, and then add it as a task to incorporate into their Macro's workflow. Please see the AI Agents and Utilities - Overview article for more information on which agents and utilities are available and how to configure them. Actions that can be performed by using the Run Utility task for example include running a macro, duplicating macros & tasks, swapping connections, running geocoding or the integrity checker on a Cosmic Frog model.
Run Macro: run a macro from within the same DataStar project as part of anothe rmacro.
Run AI Agent: within a Run AI Agent task, users can choose from a list of AI Agents, specify any required parameters, and then add it as a task to incorporate into their Macro's workflow. Please see the AI Agents and Utilities - Overview article for more information on which agents and utilities are available and how to configure them. Workflows that can be performed by using the Run AI Agent task for example include profiling and cleansing data, building a Cosmic Frog model, analyzing model outputs and generating a report, and running FTL / LTL / Air Express Freight costing workflows.
Run Machine Learning: there are 4 types of analysis a Run Machine Learning task can do on a set of data: regression, classification, geographic clustering and clustering.
Run Python: execute a Python script as part of the data workflow in a macro.
Solve Model: run Cosmic Frog scenario(s) as part of your workflow.
Users can click on a task in the tasks list and then drag and drop it onto the macro canvas to incorporate it into a macro. Once added to a macro, a task needs to be configured; this will be covered in the next section.
Configuration Tab of a Task
When adding a new task, it needs to be configured, which can be done on the Configuration tab. When a task is newly dropped onto the Macro Canvas its Configuration tab is automatically opened on the right-hand side pane. To make the configuration tab of an already existing task active, click on the task in the Macros tab on the left-hand side pane or click on the task in the Macro Canvas. The configuration options will differ by type of task, here the Configuration tab of an Import task is shown as an example:
We are on the Configuration tab on the right-hand side pane in DataStar.
The type of task is shown here, in this case it is an Import task from the Data Transfer category.
The name of the task can be entered/updated here.
The Data Connection section needs to be configured:
For each section within a task configuration, there is an indicator telling user the status of this section of the configuration. Here the green check mark indicates the Data Connection section of the task configuration has been completed. When this icon is orange, it means the configuration is not yet finished.
Sections within a configuration can be expanded/collapsed by clicking on the down/up caret icon.
Within the Data Connection configuration section, first the Source is specified:
Select the connection that will function as the source for the import task from the drop-down list containing the data connections set up in the project. Cosmic Frog, Postgres database, Excel, and CSV File connections can be used as the source for an Import task. Clicking on the plus icon to the right allows users to create a new data connection from within the task configuration tab.
For data connections with multiple tables (such as a Cosmic Frog model), users can select the table to use as the source from the drop-down list, which also shows how many records each table contains. In our example here, we are using the Shipments connection, which is a CSV file, so the 1 table in this file is used and users do not need to select anything from the drop-down list. Clicking on the grid icon to the right will open the selected table in the central part of DataStar.
Next, the Destination of the import task is configured:
Select the connection that will function as the destination for the import task from the drop-down list. This list will contain the available Postgres database connections (including the Project Sandbox and Cosmic Frog models). Oftentimes, the Project Sandbox will be the destination connection for Import tasks as the imported data will almost always still need to be cleansed, validated, and blended before reaching its final state. Again, the plus icon will let a user create a new data connection.
Data can be imported into either a new or an existing table in the Destination connection. Choose the applicable option from the drop-down.
If "New Table" was selected in the previous step, then enter the name of the new table that will be created in the destination data connection. If "Existing Table" was selected, choose the table to import the data from the Select Table drop-down list. Search, filter, and sort options are available to quickly find the desired table.
If an existing table was chosen as the destination for the import, then the source and destination columns need to be mapped to each other in the Data Mapping section. For more details on the Data Mapping section see this Quick Start Guide.
In the Run Configuration section, the resource size to be used when executing the Macro can be selected. This section is part of the configuration for all task types. Users can select the resource size they want to use for the task from the drop-down list and a link to this Help Center article which explains the different resource sizes is available from within this section too:
Please note that:
The table name is set to RawShipments in the configuration, and it will be imported to the Project Sandbox as a table named rawshipments, so the name is converted to all lowercase.
If there are spaces in the column names in the CSV file, these will be replaced by underscores when importing into the Project Sandbox. Special characters like parentheses in column names are removed. For example a column named Distance (MI) is imported as distance_mi.
The following table provides an overview of what connection type(s) can be used as the source / destination / target connection by which task(s), where PG is short for a PostgreSQL database connection and CF for a Cosmic Frog model connection:
Leapfrog Tab
Leapfrog in DataStar (aka D* AI) is an AI-powered feature that transforms natural language requests into executable DataStar Update and Run SQL tasks. Users can describe what they want to accomplish in plain language, and Leapfrog automatically generates the corresponding task query without requiring technical coding skills or manual inputs for task details. This capability enables both technical and non-technical users to efficiently manipulate data, build Cosmic Frog models, and extract insights through conversational interactions with Leapfrog within DataStar.
Note that there are 2 appendices at the end of this documentation where 1) details around Leapfrog in DataStar's current features & limitations are covered and 2) Leapfrog's data usage and security policies are summarized.
Leapfrog can be accessed by clicking on the “Ask Leapfrog AI” button in the toolbar at the top of DataStar. When you are already in Leapfrog and on the Leapfrog tab, clicking on this button again will start a new conversation.
A panel with two tabs will be opened to the right of the panel that contains the Tasks and Configuration tabs (which will be minimized upon opening Leapfrog):
Previous Leapfrog conversations can be accessed from the Conversations tab.
The current conversation will be shown in the Leapfrog tab, which will by default be the tab that is shown when opening Leapfrog.
The two tabs are by default opened so that 1 of the 2 is shown, and you can switch between them by clicking on the tabs at the top. Clicking on this icon will change the view to a split one, where both tabs are open side-by-side.
To close the Leapfrog panel, click on the cross at the right top.
When starting a new conversation, Leapfrog will show a welcome message with a short description of what it is, what is new in Leapfrog, and links to helpful resources.
This is the prompt writing area, where a user can indicate in natural language what they would like Leapfrog to do. The text prior to typing into the prompt indicates users can type an @ to get help with identifying tables and columns they may want to use in their prompt. This will be shown in screenshots further down in this section.
Once a prompt has been written, click on the send icon to submit it to Leapfrog.
The user has typed and submitted a prompt asking Leapfrog to create unique customers from the destination stores that are present in the rawshipments table (a table in the Project Sandbox) where only shipments between certain dates are to be used. Instructions to average the latitude and longitude are given in order to calculate a latitude and longitude for each customer.
While Leapfrog is working on its response, first a "Leapfrog is on it!" message will be shown, followed by updates summarizing Leapfrog's current internal process step.
The prompt area also indicates that Leapfrog is currently working on a response, so the next prompt cannot yet be submitted. Note however that you can start a new conversation or go back to an existing one and submit a prompt in there. This newly submitted prompt will then be processed in parallel with the earlier submitted prompt. Further below in this section it is explained how a new conversation can be started.
Leapfrog’s response to this prompt is as follows:
The prompt submitted by the user is listed at the top.
Leapfrog first describes in natural language what it has done in response to the prompt in the Documentation box.
It has created a Run SQL task in response to the prompt.
The Data Connection section lists that the target connection is the Project Sandbox.
In the SQL Script section, the SQL query that will be executed if adding this task as a Run SQL task to the macro is shown.
User can click on this expand icon to show the SQL Query in a bigger Code Editor window. The complete SQL Query reads:
DROPTABLE IF Exists customers;
CREATETABLE customers ASSELECT destination_store AS customer,
AVG(destination_latitude) AS latitude,
AVG(destination_longitude) AS longitude
FROM rawshipments
GROUPBY destination_store
The Notes section repeats the contents of the documentation box (see bullet 2 above), with an indication of how long the response took, and a summary of the number of characters and words. This will be added as Notes to the new task if it is is added to the Macro.
Users can provide feedback by clicking on the thumbs-up (positive) or thumbs-down (negative) icons. This way users can indicate if the Leapfrog created task was what they were expecting or not and the AI can be further improved by learning from the feedback.
Clicking on the “Add to Macro” button will add a task with this configuration to the Macro Canvas.
To help users write prompts, the tables present in the Project Sandbox and their columns can be accessed from the prompt writing box by typing an @:
The user has started typing their prompt and uses the @ character to get help with specifying a specific column in a specific table in their project sandbox.
Once the @ has been typed, a list with the tables currently present in the project sandbox comes up.
You can go through this list using the up and down arrow keys on your keyboard or you can click on the table you want to select. Once the table of your choice is selected, you can use the Enter key to close the list. This way you have selected a table without specifying a specific column in it. If you want to select a specific column in the table, use the right arrow key when you are on the table of your choice:
The user has selected the rawshipments table, which is now written in the prompt.
Using the right arrow key, the list has now changed to show the columns present in the rawshipments table.
You can again use the up and down arrow keys to go through the list, and hit the Enter key when on the column you want to select.
This user used the @ functionality repeatedly to write their prompt as follows, which helped to generate their required Run SQL task:
Now, we will also have a look at the Conversations tab while showing the 2 tabs in Split view:
We have clicked on the icon at the top left to change to Split view.
There are 3 Leapfrog conversations here. Clicking on one of them will open it up in the Leapfrog tab on the right-hand side where users can review their prior prompts and Leapfrog responses, add any tasks they had not added yet to their macro, or continue the conversation by submitting follow-up prompts.
Right-clicking on a conversation brings up a context menu with options to: 1) rename the conversation (by default its name is the text of the first prompt in the conversation), and 2) delete the conversation (the user will get a confirmation message before the conversation is deleted).
A Search box is available for users to type text into to quickly filter for conversations containing the search text in their name.
Use the Sort functionality to sort conversations chronologically of when they were created or alphabetically. Clicking again on the same sort option will reverse the order.
The "New Conversation" button can be used to start a new blank conversation.
Within a Leapfrog conversation, Leapfrog remembers the prompts and responses thus far. Users can therefore build upon previous questions, for example by following up with a prompt along the lines of “Like that, but instead of using a cutoff date of August 10, 2025, use September 24, 2025”.
This DataStar Leapfrog Prompt Library contains example prompts which will likely spark ideas on what Leapfrog is capable of and help users get more out of Leapfrog in DataStar.
Running a Macro
Users can run a Macro by selecting it and then clicking on the green Run button at the right top of the DataStar application:
The “Customers from Shipments” macro is open and is also selected in the Macros tab on the left-hand side pane (not shown).
The green Run button is enabled and clicking this will immediately kick off the macro run. Its progress can be monitored in the Macro Logs tab at the bottom of the macro canvas (see also next section) and in the Run Manager application on the Optilogic platform.
Please note that:
If a task is selected in the Macros tab on the left-hand side pane or is selected in the macro canvas by clicking on it, then clicking on the Run button will bring up following message where the user can choose to run the whole macro the task is part of or just the task by itself:
An individual task can also be run by hovering over it or selecting it by clicking on it, and then clicking on the play button that has become visible.
Macros do not need to be complete to be run, it is good practice to run individual tasks and partially completed macros before completely building out a macro without testing it along the way.
When a macro/task is running, the tasks on the macro canvas have visual indicators of the status of the run, while the Macro Logs and Task Logs tabs at the bottom also contain information on the runs, see the next section.
Macro and Task Logs Tabs
Macro Logs
Next, we will cover the Logs tabs at the bottom of the Macro Canvas where logs of macros/tasks that are running/have been run can be found:
When a macro has not yet been run, the Macro Logs tab will contain a message with a Run button, which can also be used to kick off a macro run. When a macro is running or has been run, the macro log will look similar to the following:
The pane at the bottom of the macro canvas is expanded and we are on the Macro Logs tab.
At the top of the log the name of the macro is listed. If the user switches to a different macro in the macros tab or by clicking on a tab at the top of the macro canvas, the Logs tab will display the logs of that newly selected macro.
The Total Run Time indicates how long the macro ran for (if completed) or has been running for so far (if still processing).
In the Run Selection drop-down, users can switch between looking at the logs of the current macro run and any previous runs of this particular macro.
If a Macro is still running, the Cancel Macro button can be used to abort the run.
The run summary indicates how many of the total number of tasks that were attempted to be run (the "All" number):
Errored - did not run to completion.
Are Blocked - if a task is dependent on preceding task(s), it is blocked until the preceding task(s) have completed successfully.
Are Pending - awaiting to be run.
Are Processing - are currently being executed.
Have Completed - have finished running without any errors.
The macro that was run (Customers from Shipments) has 3 tasks, Import Raw Shipments, Create Unique Customers, and Export Customers to CF Model. We see in these 3 log records that the first task has completed successfully, the second task is pending and should start processing shortly, and the third task is blocked as it is dependent on the second task completing successfully. The type of task, and when the task started and ended are listed too. Should error(s) have occurred, the last one recorded will be listed in the Last Error column.
This grid and its columns can be customized by the user, see the Appendix for details.
The next screenshot shows the log of a run of the same macro where the third task ended in an error:
For the run we are viewing the log for, the status bar indicates that 1 task errored.
Looking at the records in the grid, we see that the third task has status errored.
For this third task the last error that was encountered during the execution of the task is listed in the Last Error column. If the entire error is not visible, you can hover over it and the full text will be shown in a pop-up text box. Reading this last error may help a user pinpoint the problem, but if not, our dedicated support team can most likely help! Feel free to reach out to them on support@optilogic.com.
Please note that:
A log is recorded in the Macro Logs tab while a macro is running, users can watch the real-time updates if the Macro Logs tab is open.
No log is available for a macro that has not yet been run.
Task Logs
For the following supported tasks a task log is generated when the task is run: Import, Export, Run Utility, Run AI Agent, Run Machine Learning, Run Python, and Solve Model. An example is shown in the next screenshot for a Run AI Agent task using the Data Cleansing AI Agent:
Data Connections Tab
In the Data Connections tab on the left-hand side pane the available data connections are listed:
User has clicked on the Data Connections tab in the left-hand side pane of DataStar to make this the active tab.
In the top part of the connections list, the Active and Bookmarked Connections are listed; by default the list is expanded. Active means the connection is used by 1 or more tasks in any of the macros of the currently open project. Users can manage which connections are bookmarked themselves by adding and removing bookmarks., see also further below in this section on how to do this. Connections can be expanded to view their content (e.g. the tables/views contained in them) by clicking on the caret icon to the left of the connection's name. See the next screenshot for what the connections list looks like when the connections are expanded.
Active connections are indicated with this green checkmark icon.
Bookmarked connections are labeled with this blue icon. Bookmarks are project-based: a bookmarked connection in 1 project is not automatically bookmarked in other DataStar projects.
All other Data Connections currently set up within DataStar are listed in the All Connections list, which is also expanded by default. With the exception of the Project Sandbox, which is unique to each project, all connections are accessible by all DataStar projects.
To quickly find specific connections and/or tables contained in them, users can type into the Search box. Connections and tables with the search text in their names will be filtered out and shown in the list. Please note that for the search to be performed on tables within a data connection, the data connection needs to be expanded (see previous bullet). If the option to not show empty tables is enabled (next bullet), then the search will also not search these empty tables and only return populated tables.
Clicking on the filter icon will bring up 2 options for what is included when showing the contents of connections:
Show Empty Tables - the user can choose to show these in the tables list when the connection is expanded by leaving the checkbox enabled (default) or, alternatively, disable this checkbox so that empty tables are hidden.
Show Views - database connections can have views in them, which are named queries that run on 1 or multiple tables in the database. By default this checkbox is unchecked and views are not shown when a connection is expanded. However, users can choose to show them by enabling this checkbox.
Next, we will have a look at what the connections list looks like when some of the connections have been expanded:
The Project Sandbox connection, which is a Postgres database underneath, has been expanded:
There are multiple schemas present in the Project Sandbox database; the one that contains the tables and will be shown when expanded is the Starburst schema.
We see that there are 2 tables here which have been populated by running the Customers from Shipments macro: the rawshipments table is the result of the Import task ("Import Raw Shipments") in the macro; it has 42.66k records. The customers table is the result of running the Run SQL task ("Create Unique Customers") and this has resulted in 1.33k unique customers.
The Historical Shipments connection is the CSV File data connection connected to the shipments.csv file which contains raw shipment data. Since it is a CSV File connection, it has 1 table in it, which has the same name as the csv file it is connected to (shipments).
This Cosmic Frog model connection is named Global Dairy E2E. Cosmic Frog models are also Postgres databases underneath with a specific schema that Optilogic's Cosmic Frog application uses for optimizations (including network and transportation), simulations (including inventory), and Greenfield runs.
The schema used for the tables in a Cosmic Frog model is called anura_2_8 and this schema is expanded in the connection to view the tables.
In this example, we have chosen not to show empty tables and we see the first 10 populated tables in the list.
In this screenshot, showing empty tables has been turned off using the filter option at the right top of the tab. The blue dot at the right top of the filter icon gives a visual indication that a filter is applied.
Right-clicking on a connection brings up the following context menu:
Use the Refresh option to view the connection's most recent data.
If a connection is already bookmarked, an option to remove the bookmark is available. For connections that are not bookmarked, the option here is to bookmark the connection.
An option to Delete the connection is available too. This removes the connection from all DataStar projects, also when it is in use (active) in any other project.
Right-clicking on a table in a connection also brings up a context menu:
Use the Export to CSV option to create a CSV file containing the contents of the table. The CSV file will be available for download from https://optilogic.app/#/user-downloads; a new browser tab with this page will automatically open.
For Cosmic Frog model connections, Postgres database connections, and the Project Sandbox, users have the option to open them in SQL Editor. Clicking on this option opens a new browser tab with the selected database open in SQL Editor.
For tables in the Project Sandbox, users have the option to drop them (remove them). This is especially useful when testing out a macro that is in development: before re-running the updated macro, the user may want to drop any tables the macro creates.
Viewing a Connection's Table
The tables within a connection can be opened within DataStar. They are then displayed in the central part of DataStar where the Macro Canvas is showing when a macro is the active tab.
Please note:
Currently, a data preview of up to 10,000 records for a table is displayed for tables in DataStar. This means that any filtering or sorting done on tables larger than 10k records is done on this subset of 10k records. At the end of this section it is explained how datasets containing more than 10k records per table can be explored by using the SQL Editor application.
Since the Excel data connection is currently in its beta version, data previews are not yet available for it.
A table is opened in the central part of DataStar by clicking on it in the connections list. Here the user clicked on the rawshipments table to open it. The tabs across the top of the central part where the table is now displayed have the name of the table or macro that is open in that tab on them. Users can switch between tables and macros by clicking on the tabs. Currently, the rawshipments table and the "Customers from Shipments" macro are both open, with the rawshipments table being shown since that is the active tab.
At the moment, DataStar will show a preview of up to 10,000 records of any table. The total number of records in the table is also mentioned here. As mentioned above, this also means that any filtering or sorting is performed on this subset of up to 10k records.
An additional menu named Table Functions is available in the toolbar when a table is open in DataStar's central part. Options from this menu are:
Export to CSV - this will export the table to a csv file which will be accessible from user's Downloads area on the Optilogic platform (click on your username at the right top of the screen and select Downloads from the drop-down list). Note to check back in a few minutes if you do not see the download there immediately.
Open in SQL Editor - for databases, this will open the database in the SQL Editor application on the Optilogic platform and show the table that was active in DataStar. A screenshot of a DataStar project sandbox database in SQL Editor and a link to a Help Center article on the SQL Editor application are included at the end of this section.
This grid can be customized by the user (e.g. sort and change the order of columns), see the appendix on how to do this.
Users can also filter the grid based on values in one or multiple columns. The next screenshot covers this in more detail.
On the right-hand side, there are 2 panes available that will become visible when clicking on their names: 1) Columns: to configure which columns are shown in the grid and in which order, and 2) Filters: filters can also be configured from this fold out pane. Each of these are covered in a screenshot further below in this section. Once a pane has been opened, it can be closed again by clicking on its name on the right-hand side of the pane once more.
A table can be filtered based on values in one or multiple columns:
A column that has been filtered can be recognized by the blue filter icon to the right of the column name. This filter icon is black when not filtering on this column. Clicking on the filter icon brings up a form where filters can be configured.
Currently, the origin_dc field is filtered for records where the value contains the text "dallas". This is non-case sensitive and all records that have "dallas" in their name (whether at the start, at the end or somewhere in between) will be filtered out and shown. Please note that:
Once a user hits the Enter key after typing into the Filter... text box, the filter is applied.
To remove a filter, users need to delete the text from the Filter... text box.
A filter can consist of multiple parts and whether only records that satisfy all filter parts are shown or records that satisfy at least one of the parts are shown depends on the selection of "AND" vs "OR" here. When using AND, only records that satisfy all filter parts will be shown. When using OR, records that satisfy at least one of the filter parts will be shown.
Besides filtering records for their values containing certain text (see bullet 2 above), there are additional options available as shown in this drop-down list. After selecting the desired option, user can type in the Filter... text box (not visible in the above screenshot as it is covered by the filter type drop-down list). The drop-down list shown in the above screenshot is for columns of string/text data type. Different options are available for columns containing numerical data, as shown here for the Units column:
Columns can be re-ordered and hidden/shown as described in the Appendix; this can be done using the Columns fold-out pane too:
Click on Columns on the right-hand side of the table to open the Columns pane.
To find the column(s) of interest quickly, users can type into the Search... text box to filter the list of columns down to those containing the typed text in their name.
These checkboxes are used to hide/show columns in the grid: uncheck a column's checkbox to hide it. Note that the checkbox at the top of the list can be used to hide/show all columns with one click.
The order of the columns in the grid can be changed by clicking on the icon with 4x3 dots, then hold the mouse down and drag the column up or down. Let go of the mouse once the column is in the desired position.
Finally, filters can also be configured from a fold-out pane:
Click on Filters on the right-hand side of the table to open the Filters pane.
To find the column(s) you want to filter on quickly, you can type into the Search... text box to filter the list of columns down to those containing the typed text in their name.
Click on the caret icon to the left of the column name that you want to apply the filter to so that it expands and the filter configuration for the column becomes visible. Configure the filter as covered above by selecting the filter type from the drop-down and typing the filter criterion into the Filter... text box.
A column that has a filter applied to it already can be recognized in the list: it has a filter icon to the right of its column name whereas unfiltered columns have no such icon displayed.
Users can explore the complete dataset of connections with tables larger than 10k records in other applications on the Optilogic platform, depending on the type of connection:
Lightning Editor: for CSV files
SQL Editor: for Postgres DB connections, which includes the Project Sandbox and Cosmic Frog models. See this SQL Editor Overview help center article on how to use the SQL Editor. For the Project Sandbox, please note that:
The name of the Project Sandbox database is the same as the project name
The tables that are created in the sandbox can be found under the “starburst” schema
Here is how to find the database and table(s) of interest in SQL Editor:
When logged into the Optilogic platform, click on the SQL Editor icon in the list of available applications on the left-hand side to open it. Your SQL Editor icon may be in a different location in the list, and if it is not visible at all, then click on the icon with 3 horizontal dots to show any applications that are not shown currently.
Either use the Search box at the top to find your database of interest or scroll through the list. DataStar project sandbox databases can be recognized by the DataStar logo to the left of the database name. The name of a DataStar project sandbox database is that of the DataStar project it belongs, in our example "Import Historical Shipments".
When expanding the database, the starburst schema which contains the tables contained in the data connection will by default be expanded too.
We see the customers and raswhipments tables that were the result of running the Customers from Shipments macro. Clicking on a table will run a query to show the first 20 records of that table.
Helpful Resources
Here are a few additional links that may be helpful:
Additional DataStar documentation on Optilogic's Help Center can be found in this Navigating DataStar section.
We hope you are as excited about starting to work with DataStar as we are! Please stay tuned for regular updates to both DataStar and all the accompanying documentation. As always, for any questions or feedback, feel free to contact our support team at support@optilogic.com.
Appendix - Customizing Grids
The grids used in DataStar can be customized and we will cover the options available through the screenshot below. This screenshot is of the list of CSV files in user's Optilogic account when creating a new CSV File connection. The same grid options are available on the grid in the Logs tab and when viewing tables that are part of any Data Connections in the central part of DataStar.
The columns in the grid can be dragged to change the order of the columns, and they can also be resized by clicking on the vertical bar in between the columns (the mouse then changes to 2 arrows pointing away from each other), holding the mouse down and moving right or left. Double-clicking while hovering over the vertical bar (mouse has changed to 2 arrows pointing away from each other) will autosize the column to fit the longest value.
The grid can be sorted by the values of a column by clicking on its column name; this will sort the column in ascending order. Clicking on the column name will change the sort to be in descending order and clicking a third time takes the sort off the column. Sorting by multiple columns is possible too: sort the first column as desired, then hold down the Ctrl and Shift keys while clicking on the name(s) of a second, third, etc. column to add them to the multi-sort. Numbers indicate the order of the sort. Here, the grid was first sorted by the Location column and then by File Name.
Clicking on the icon with 3 vertical dots to the right of a column name will bring up a context menu with the following options:
Sort Ascending / Sort Descending / Clear Sort: depending on if the column is sorted and if so, how, 2 of these 3 options will be listed for each column to quickly change / take off the sort on this column.
Pin Column: columns can be put in a fixed position that will stay visible when scrolling. Options are to pin the column all the way to the left or all the way to the right of the grid.
Autosize This column: change the width of the column to fit the longest value.
Autosize All Columns: change the width of all columns in the grid to fit their longest values.
Choose Columns: brings up the list of columns present in the grid with the options to 1) hide them by unchecking their checkboxes and / or 2) change the column order by dragging columns to different positions in the list.
Reset Columns: unhides all columns if any are hidden and puts them in their original order.
Appendix - Leapfrog Features & Limitations
Current Version Features:
Text to SQL generation capabilities through Run SQL and Update tasks. Currently, the following types of SQL queries are supported:
Insert
Update
Delete
Drop Table
Create Table
Alter Table
Union
Supported data connections: Project Sandbox (Starburst schema) relevant to the DataStar project. Use the @ character in prompts to let Leapfrog help you with the table and column names.
Output formats - each prompt response typically contains:
Description on what Leapfrog creates in the Documentation part
Run SQL or Update task
Add to Macro option
Notes section which repeats the documentation text, plus an indication of how long the response took, and the number of characters and words. This becomes the Notes section of the task if it is added to the macro.
Multi-turn conversation: Leapfrog has a ‘memory’ within each conversation. This means users can reference a previous prompt or response in a subsequent request.
Conversation history is kept and user can go back to previous conversations to for example add any tasks to a macro that were not added yet or continue a conversation from where it was left off.
Multiple conversations can be working on a prompt response simultaneously.
Multi-language support: users can submit their prompt in languages other than English, and the Documentation part of the response will be in the same language.
Current Limitations
Each task created from Leapfrog can only use 1 connection at a time, and this connection is the Project Sandbox (Starburst). Moving data from one connection to another is not yet supported.
Leapfrog in DataStar cannot answer questions about its own capabilities yet.
Appendix - Leapfrog Data Usage & Security
Training Data
Leapfrog's brainpower comes from:
Optilogic's Anura schema
Hundreds of handcrafted SQL examples from real supply chain experts
All training processes are owned and managed by Optilogic — no outside data is used.
Using Leapfrog
When you ask Leapfrog a question:
It securely accesses your data through an API.
Your data stays yours — no external sharing or external training.
Conversation History
Your conversations (prompts, answers, feedback) are stored securely at the user level.
Only you and authorized Optilogic personnel can view your history.
Other users cannot access your data.
Privacy and Ownership
You retain full ownership of your model data. Only authorized Optilogic personnel can access it.
Optilogic uses industry-standard security protocols to keep everything safe and sound.