

Dendro, Optilogic’s simulation-optimization engine, uses a sophisticated Genetic Algorithm (GA) to, for example, optimize inventory policies across your supply chain network. This guide explains how the algorithm works in business-friendly terms, helping you understand what happens when you run Dendro and how to get the best results.
The Big Picture: Dendro's Genetic Algorithm explores thousands of different inventory policy combinations, simulates each one to see how it performs, and gradually evolves toward the best possible solution - much like natural evolution produces better-adapted organisms over time.
Recommended reading prior to diving into this guide: Getting Started with Dendro, which is a higher-level overview of how Dendro works.
Genetic Algorithms are inspired by biological evolution. Just as species evolve to become better adapted to their environment through:
Dendro evolves inventory policies to become better adapted to your business objectives through:
Traditional optimization methods struggle with inventory networks due to:
Genetic Algorithms excel at this type of problem because they:
Dendro's implementation uses three fundamental elements: chromosomes, genes, and fitness score.
A chromosome represents one complete set of inventory policies for your entire supply chain.
Example Chromosome:
Each chromosome is essentially a complete "proposal" for how to manage inventory across your network.
Each gene within a chromosome represents the policy for one facility-product combination.
Example Gene:
Genes can mutate (change their values) to explore different policy settings.
The fitness score measures how good a chromosome is - combining costs, service levels, and other objectives.
Higher scores are better - Dendro displays scores where better solutions have higher values.
A fitness score might combine:
Whenever the below refers to an option, this is a model run option that can be set in the Dendro section of the Technology Parameters on the right-hand side of the Run Settings screen that comes up after a user clicks on the green Run button in Cosmic Frog.
What happens: Dendro creates the initial population of chromosomes (policy combinations).
Implementation details:
Business perspective: Think of this as Dendro assembling a diverse team of proposals. The first proposal is "keep doing what we are doing", while the others explore variations like "increase safety stock by 10%", "reduce order quantities", etc.
Each generation follows the same four-step cycle:
What happens: Each chromosome is evaluated by:
Implementation details:
Business perspective: Dendro tests each proposal by running it through a realistic simulation of your supply chain over time. It is like running a pilot program for each policy combination to see what would actually happen - but virtually, so you can test thousands of options without risk.
Typical duration:
What happens: Dendro ranks all chromosomes by fitness score and selects the best ones to continue to the next generation.
Implementation details:
Business perspective: After testing all proposals, Dendro keeps the most promising ones and discards the poor performers. This is like a review committee keeping the best ideas and dropping the ones that do not work well.
Example:
Generation 5 Results (20 chromosomes evaluated):
What happens: Dendro creates new chromosomes by combining parts of two successful parent chromosomes.
Implementation details:
Business perspective: Dendro creates new proposals by combining the best parts of successful proposals. If one policy set works well for East Coast facilities and another works well for high-volume products, crossover might create a policy that combines both successful approaches.
Example with 1-Point Crossover:
Parent 1: [Gene_A1, Gene_A2, Gene_A3, Gene_A4, Gene_A5]
Parent 2: [Gene_B1, Gene_B2, Gene_B3, Gene_B4, Gene_B5]
↑ Crossover point
Offspring 1: [Gene_A1, Gene_A2, Gene_A3 | Gene_B4, Gene_B5]
Offspring 2: [Gene_B1, Gene_B2, Gene_B3 | Gene_A4, Gene_A5]
When crossover is most effective:
What happens: Dendro randomly adjusts policy values in the new chromosomes to explore variations.
Implementation details:
Business perspective: Dendro introduces controlled randomness to explore new options. Even the best current policies might not be optimal, so mutation ensures the algorithm does not get stuck. It is like saying "this policy works well at 500 units, but let's try 525 and 475 too".
Example mutations:
Original Gene: Reorder Point = 500, Order-Up-To = 1000
Mutated Gene: Reorder Point = 525, Order-Up-To = 1050
Mutation strategies:
Input factors define what Dendro can change. They are the "variables" in your optimization problem. They can be specified in the Input Factors input table in your Cosmic Frog model.
Common input factors:
How they work in chromosomes: Each input factor becomes a position in the chromosome. Dendro explores different values for each position.
Example: If you have 50 facility-product combinations to optimize, and each has two policy values (reorder point and order-up-to), your chromosome has 50 genes, each with 2 values = 100 total parameters being optimized.
Input factors are covered in detail in the Dendro: Input Factors Guide.
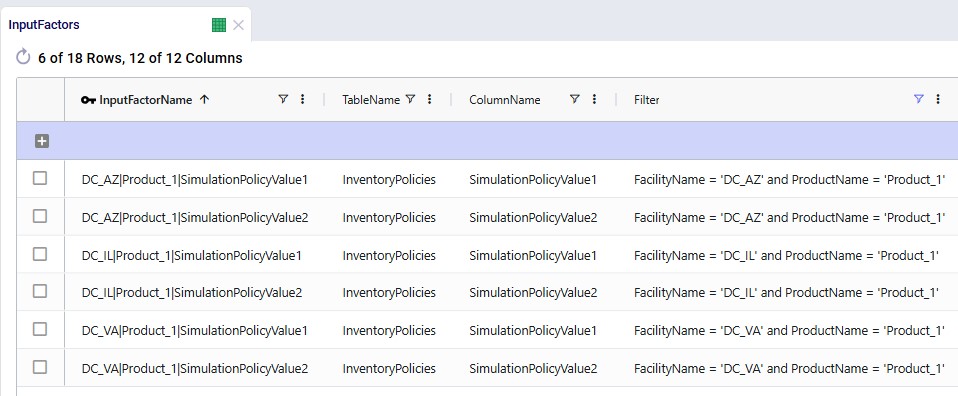
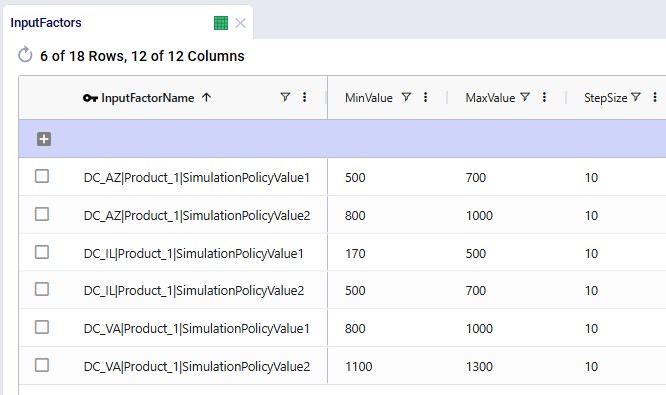
The following 2 screenshots show 6 records in an Input Factors input table in Cosmic Frog. Both simulation policy values for Product_1 at 3 different DCs are specified in these records:
Output factors define what Dendro tries to minimize. They are the "objectives" in your optimization problem. Output factors can be set in the Output Factors input table.
Common output factors:
How they combine - each output factor has a:
The Dendro: Output Factors Guide covers output factors in more detail.
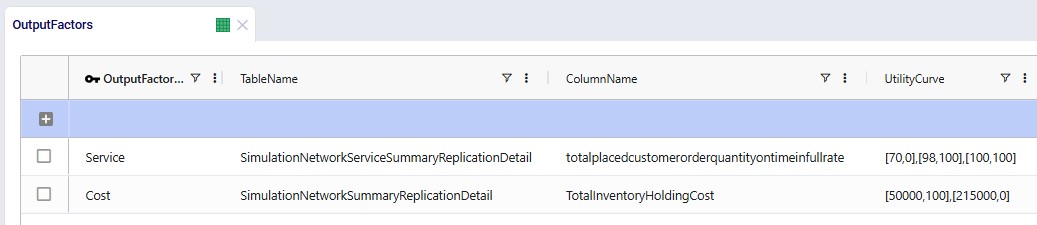
The following screenshot shows an output factors table containing 2 output factors, one measuring service and the other cost:
Utility curves convert simulation outputs into comparable fitness scores.
Why we need them:
How they work:
Example:
Holding Cost Utility Curve:
Business benefit: Utility curves let you define what "good" and "bad" mean for each metric. They translate apples-and-oranges metrics into a single comparable score.
The overall fitness score is the weighted sum of all output factors.
Formula:
Fitness Score = Σ(Weighted Score for each Output Factor)
Where for each factor:
Weighted Score = (Normalized Score from Utility Curve) × (Factor Weight)
Higher is better - Better solutions receive higher fitness scores.
Example calculation:
Output Factors:
1. Holding Cost: $75,000 → Raw Score 75 → Weighted 22.5 (weight 30%)
2. Transport Cost: $40,000 → Raw Score 60 → Weighted 15.0 (weight 25%)
3. Stockout Penalty: $10,000 → Raw Score 80 → Weighted 20.0 (weight 25%)
4. Service Level: 96% → Raw Score 90 → Weighted 18.0 (weight 20%)
Overall Fitness = 22.5 + 15.0 + 20.0 + 18.0 = 75.5 points
Important note: Scores are recalculated when new min/max values are discovered to ensure fair comparison across all generations.
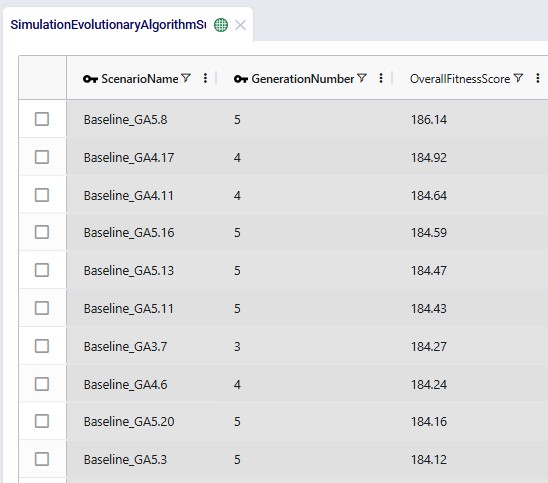
After a Dendro run completes, the fitness scores of all scenarios (=chromosomes) of all generations can be found in the Simulation Evolutionary Algorithm Summary output table (showing the top 10 records here with the highest overall fitness scores):
The challenge: Early in the optimization, Dendro does not know what the best and worst possible values are for each metric. As it explores, it might find:
The solution: Dendro dynamically rescales utility curves when new extremes are discovered.
What happens:
Business perspective: This ensures that a solution that looked "good" in Generation 2 is not unfairly favored if better solutions are discovered later. Everyone is judged by the same standard.
Keeping the best results:
Small population, many generations:
Characteristics:
Large population, fewer generations:
Characteristics:
Balanced approach (recommended):
High mutation (100% probability):
Low mutation (30-50% probability):
Single-point crossover (default):
Points To Crossover = 1
Multi-point crossover:
Points To Crossover = 2 or more
When to disable crossover:
Key indicators of healthy optimization:
The Simulation Evolutionary Algorithm Summary output table can be used to assess the above 2 points as it contains the fitness scores of all scenarios (=chromosomes) that were run for all generations. See an example screenshot of this table further above in the Fitness Score Calculation section.
This last point can be assessed by reviewing the logs of the base scenario used for the Dendro run.
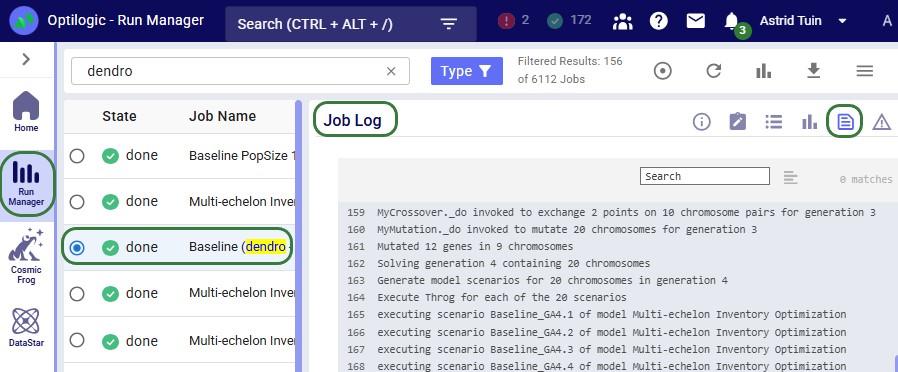
Logging output: Dendro logs key events. These can be found in the Run Manager application, which is another application on the Optilogic platform. The Job Log of the base scenario that Dendro is run on contains quite a lot of detailed on events, such as:
This screenshot shows part of a Job Log for a Dendro run:
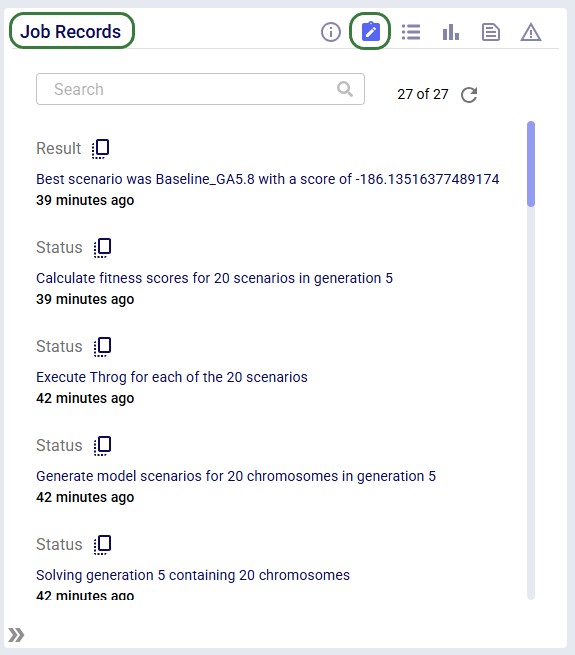
The Job Records log, which can be accessed by clicking on the second icon in the row of icons at the top right of the logs provides a higher level summary of the Dendro run, just calling out the main events:
The GA excels in following situations:
The mechanism: Dendro automatically detects and eliminates duplicate chromosomes.
How it works:
Business benefit: Ensures computational resources are used efficiently - never simulating the same policy combination twice.
Challenge: Each chromosome generates a simulation scenario with potentially gigabytes of output data.
Solution:
Business benefit: You can analyze the best solutions in detail without storing data for thousands of unsuccessful experiments.
Network:
Configuration:
Process:
Generation 1:
Generations 2-10:
Generations 11-15:
Generations 16-20:
Results:
Dendro's Genetic Algorithm is a powerful, flexible optimization engine that:
By understanding how the algorithm works, you can:
The GA is not magic – it is a systematic, intelligent search process. Like any tool, it works best when used thoughtfully and configured appropriately for your specific situation.
You may find these links helpful, some of which have already been mentioned above:
Please do not hesitate to contact the Optilogic Support team on support@optilogic.com for any questions or feedback.

Dendro, Optilogic’s simulation-optimization engine, uses a sophisticated Genetic Algorithm (GA) to, for example, optimize inventory policies across your supply chain network. This guide explains how the algorithm works in business-friendly terms, helping you understand what happens when you run Dendro and how to get the best results.
The Big Picture: Dendro's Genetic Algorithm explores thousands of different inventory policy combinations, simulates each one to see how it performs, and gradually evolves toward the best possible solution - much like natural evolution produces better-adapted organisms over time.
Recommended reading prior to diving into this guide: Getting Started with Dendro, which is a higher-level overview of how Dendro works.
Genetic Algorithms are inspired by biological evolution. Just as species evolve to become better adapted to their environment through:
Dendro evolves inventory policies to become better adapted to your business objectives through:
Traditional optimization methods struggle with inventory networks due to:
Genetic Algorithms excel at this type of problem because they:
Dendro's implementation uses three fundamental elements: chromosomes, genes, and fitness score.
A chromosome represents one complete set of inventory policies for your entire supply chain.
Example Chromosome:
Each chromosome is essentially a complete "proposal" for how to manage inventory across your network.
Each gene within a chromosome represents the policy for one facility-product combination.
Example Gene:
Genes can mutate (change their values) to explore different policy settings.
The fitness score measures how good a chromosome is - combining costs, service levels, and other objectives.
Higher scores are better - Dendro displays scores where better solutions have higher values.
A fitness score might combine:
Whenever the below refers to an option, this is a model run option that can be set in the Dendro section of the Technology Parameters on the right-hand side of the Run Settings screen that comes up after a user clicks on the green Run button in Cosmic Frog.
What happens: Dendro creates the initial population of chromosomes (policy combinations).
Implementation details:
Business perspective: Think of this as Dendro assembling a diverse team of proposals. The first proposal is "keep doing what we are doing", while the others explore variations like "increase safety stock by 10%", "reduce order quantities", etc.
Each generation follows the same four-step cycle:
What happens: Each chromosome is evaluated by:
Implementation details:
Business perspective: Dendro tests each proposal by running it through a realistic simulation of your supply chain over time. It is like running a pilot program for each policy combination to see what would actually happen - but virtually, so you can test thousands of options without risk.
Typical duration:
What happens: Dendro ranks all chromosomes by fitness score and selects the best ones to continue to the next generation.
Implementation details:
Business perspective: After testing all proposals, Dendro keeps the most promising ones and discards the poor performers. This is like a review committee keeping the best ideas and dropping the ones that do not work well.
Example:
Generation 5 Results (20 chromosomes evaluated):
What happens: Dendro creates new chromosomes by combining parts of two successful parent chromosomes.
Implementation details:
Business perspective: Dendro creates new proposals by combining the best parts of successful proposals. If one policy set works well for East Coast facilities and another works well for high-volume products, crossover might create a policy that combines both successful approaches.
Example with 1-Point Crossover:
Parent 1: [Gene_A1, Gene_A2, Gene_A3, Gene_A4, Gene_A5]
Parent 2: [Gene_B1, Gene_B2, Gene_B3, Gene_B4, Gene_B5]
↑ Crossover point
Offspring 1: [Gene_A1, Gene_A2, Gene_A3 | Gene_B4, Gene_B5]
Offspring 2: [Gene_B1, Gene_B2, Gene_B3 | Gene_A4, Gene_A5]
When crossover is most effective:
What happens: Dendro randomly adjusts policy values in the new chromosomes to explore variations.
Implementation details:
Business perspective: Dendro introduces controlled randomness to explore new options. Even the best current policies might not be optimal, so mutation ensures the algorithm does not get stuck. It is like saying "this policy works well at 500 units, but let's try 525 and 475 too".
Example mutations:
Original Gene: Reorder Point = 500, Order-Up-To = 1000
Mutated Gene: Reorder Point = 525, Order-Up-To = 1050
Mutation strategies:
Input factors define what Dendro can change. They are the "variables" in your optimization problem. They can be specified in the Input Factors input table in your Cosmic Frog model.
Common input factors:
How they work in chromosomes: Each input factor becomes a position in the chromosome. Dendro explores different values for each position.
Example: If you have 50 facility-product combinations to optimize, and each has two policy values (reorder point and order-up-to), your chromosome has 50 genes, each with 2 values = 100 total parameters being optimized.
Input factors are covered in detail in the Dendro: Input Factors Guide.
The following 2 screenshots show 6 records in an Input Factors input table in Cosmic Frog. Both simulation policy values for Product_1 at 3 different DCs are specified in these records:
Output factors define what Dendro tries to minimize. They are the "objectives" in your optimization problem. Output factors can be set in the Output Factors input table.
Common output factors:
How they combine - each output factor has a:
The Dendro: Output Factors Guide covers output factors in more detail.
The following screenshot shows an output factors table containing 2 output factors, one measuring service and the other cost:
Utility curves convert simulation outputs into comparable fitness scores.
Why we need them:
How they work:
Example:
Holding Cost Utility Curve:
Business benefit: Utility curves let you define what "good" and "bad" mean for each metric. They translate apples-and-oranges metrics into a single comparable score.
The overall fitness score is the weighted sum of all output factors.
Formula:
Fitness Score = Σ(Weighted Score for each Output Factor)
Where for each factor:
Weighted Score = (Normalized Score from Utility Curve) × (Factor Weight)
Higher is better - Better solutions receive higher fitness scores.
Example calculation:
Output Factors:
1. Holding Cost: $75,000 → Raw Score 75 → Weighted 22.5 (weight 30%)
2. Transport Cost: $40,000 → Raw Score 60 → Weighted 15.0 (weight 25%)
3. Stockout Penalty: $10,000 → Raw Score 80 → Weighted 20.0 (weight 25%)
4. Service Level: 96% → Raw Score 90 → Weighted 18.0 (weight 20%)
Overall Fitness = 22.5 + 15.0 + 20.0 + 18.0 = 75.5 points
Important note: Scores are recalculated when new min/max values are discovered to ensure fair comparison across all generations.
After a Dendro run completes, the fitness scores of all scenarios (=chromosomes) of all generations can be found in the Simulation Evolutionary Algorithm Summary output table (showing the top 10 records here with the highest overall fitness scores):
The challenge: Early in the optimization, Dendro does not know what the best and worst possible values are for each metric. As it explores, it might find:
The solution: Dendro dynamically rescales utility curves when new extremes are discovered.
What happens:
Business perspective: This ensures that a solution that looked "good" in Generation 2 is not unfairly favored if better solutions are discovered later. Everyone is judged by the same standard.
Keeping the best results:
Small population, many generations:
Characteristics:
Large population, fewer generations:
Characteristics:
Balanced approach (recommended):
High mutation (100% probability):
Low mutation (30-50% probability):
Single-point crossover (default):
Points To Crossover = 1
Multi-point crossover:
Points To Crossover = 2 or more
When to disable crossover:
Key indicators of healthy optimization:
The Simulation Evolutionary Algorithm Summary output table can be used to assess the above 2 points as it contains the fitness scores of all scenarios (=chromosomes) that were run for all generations. See an example screenshot of this table further above in the Fitness Score Calculation section.
This last point can be assessed by reviewing the logs of the base scenario used for the Dendro run.
Logging output: Dendro logs key events. These can be found in the Run Manager application, which is another application on the Optilogic platform. The Job Log of the base scenario that Dendro is run on contains quite a lot of detailed on events, such as:
This screenshot shows part of a Job Log for a Dendro run:
The Job Records log, which can be accessed by clicking on the second icon in the row of icons at the top right of the logs provides a higher level summary of the Dendro run, just calling out the main events:
The GA excels in following situations:
The mechanism: Dendro automatically detects and eliminates duplicate chromosomes.
How it works:
Business benefit: Ensures computational resources are used efficiently - never simulating the same policy combination twice.
Challenge: Each chromosome generates a simulation scenario with potentially gigabytes of output data.
Solution:
Business benefit: You can analyze the best solutions in detail without storing data for thousands of unsuccessful experiments.
Network:
Configuration:
Process:
Generation 1:
Generations 2-10:
Generations 11-15:
Generations 16-20:
Results:
Dendro's Genetic Algorithm is a powerful, flexible optimization engine that:
By understanding how the algorithm works, you can:
The GA is not magic – it is a systematic, intelligent search process. Like any tool, it works best when used thoughtfully and configured appropriately for your specific situation.
You may find these links helpful, some of which have already been mentioned above:
Please do not hesitate to contact the Optilogic Support team on support@optilogic.com for any questions or feedback.


