

The Data Profiler AI Agent is one of Ada's AI-powered assistants, focused on assessing data. It automatically analyzes the quality, structure, and relationships of data stored in an Optilogic database. By profiling every table and column, the agent creates a comprehensive data-quality catalog that helps users understand their data, identify issues, discover relationships, and prioritize cleansing efforts.
The agent can be accessed by chatting with Ada in the next generation Optilogic platform and via Run AI Agent tasks in DataStar.
Understanding the quality and meaning of data is often one of the most time-consuming steps in any analytics, modeling, or optimization project. The Data Profiler AI Agent automates this process by:
The result is a queryable inventory of your data assets, complete with quality assessments and relationship insights.
The Data Profiler AI Agent performs several layers of analysis.
For every table and column, the agent calculates statistical characteristics such as:
For large datasets, the agent uses deterministic sampling to ensure consistent results across profiling runs.
Using LLM-assisted analysis, the agent generates:
These descriptions help users quickly understand the purpose and meaning of data assets.
Based on semantic classifications, the agent recommends appropriate database data types. Examples include:
These recommendations help improve data consistency and prevent issues such as loss of leading zeros in identifiers.
After semantic types are identified, the agent performs specialized validation checks against actual data values. Examples include:
The agent performs dozens of validation checks tailored to the detected semantic type.
Each detected issue is stored as a single row structured alert. Each alert contains:
Notable specialized checks include:
The agent can identify relationships even when keys are not formally defined in the schema.
The discovery process includes
The Data Profiler AI Agent assigns scores ranging from 0.0 to 1.0 across three dimensions:
The overall score is a weighted average, which is capped if data integrity drops too low. Tables without data receive a baseline minimum score, while tables that generate errors display an error stub so users are always aware of the issue.
Measures whether values are:
When the same column name appears in multiple tables with different semantic tags, a majority vote picks one and corrects the outliers.
The only required input is to point the agent to a database. There are several optional inputs which we will cover in the Using the Data Profiler Agent section below.
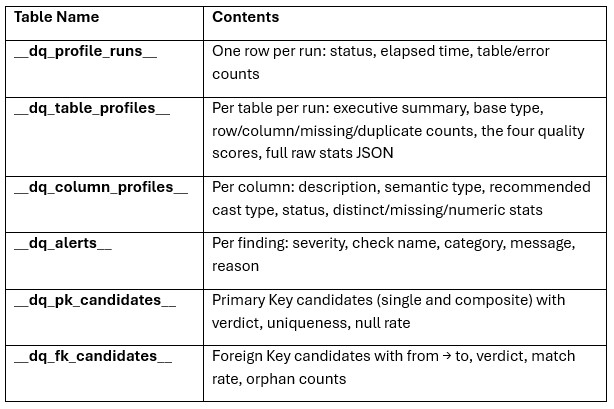
The output consists of tables written to the database that was profiled:
In addition to database outputs, the agent generates a timestamped execution log, which includes table processing times, alerts, and primary key/foreign key findings. Reviewing the log can help diagnose profiling issues and understand execution performance.
There are two ways to access the Data Profiler Agent:
Both ways will be explained, through DataStar first, then using the chat UI.
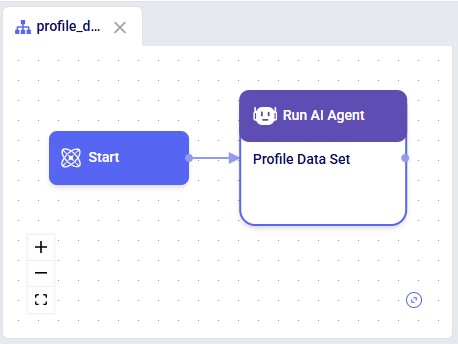
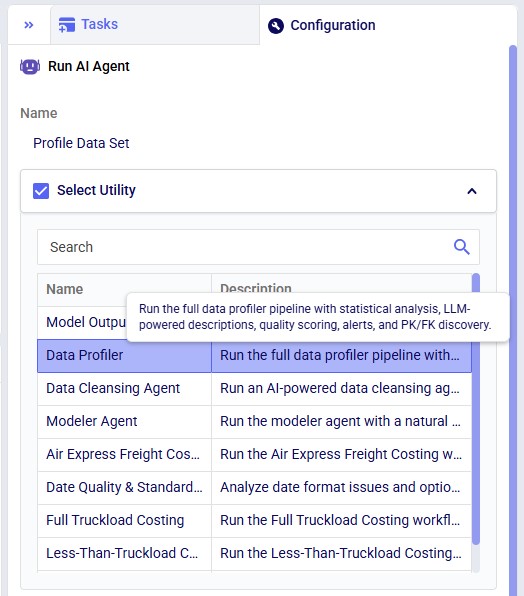
Accessing the Data Profiler Agent through DataStar is done via a Run AI Agent task:
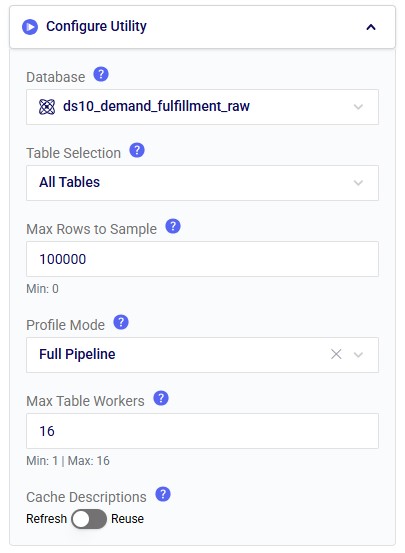
In the Configure Utility section of the Configuration tab (from top to bottom):
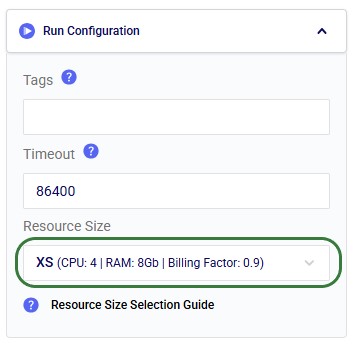
Note that it is recommended to change the Resource Size from 3XS to XS in the Run Configuration section, since 3XS is usually not sufficient to run the Data Profiler Agent:
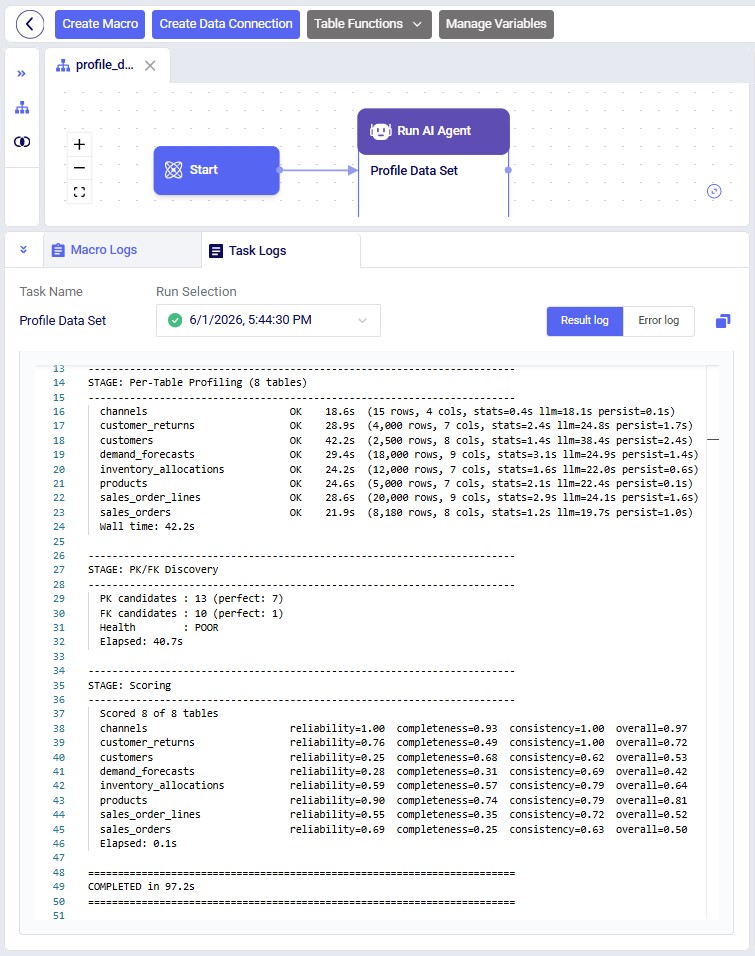
While the task is running and after it has completed, the Task Logs tab contains the log file where the user can monitor progress and review key alerts and high-level output summaries:
As an example output, let us have a look at the _dq_table_profiles table:
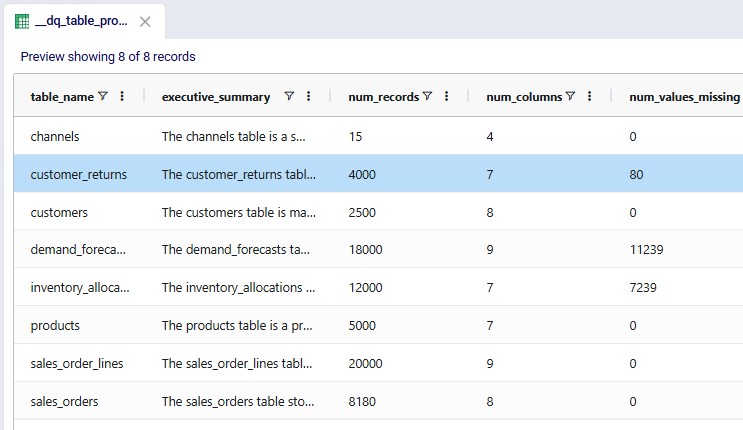
In this table, the entire executive summary for the customer_returns table is as follows: "The customer_returns table records return events tied to individual sales order lines, supporting analysis of return volumes, reasons, and financial impact. Each record links a return reference return_id to an order_line_id, with return_date providing the time dimension for trend reporting. Operational metrics include return_qty and restock_flag, while refund_amount captures the customer reimbursement value but is stored as text and includes invalid entries. Return reasons are mostly standardized but include missing values and placeholder or corrupted categories, suggesting a need for data cleansing and validation."
It is recommended to be somewhat familiar with Ada and how to talk to her in the chat UI before diving into this content. Please see the Getting Started with Ada & Agentic AI article, and in particular its How to Use Ada section.
Once logged into the next generation Optilogic platform at https://ai.optilogic.app, you can start chatting with Ada and leveraging the Data Profiler Agent right away from the central part of the Home page. You can access it by using the Data Cleanser Agent, as this agent can call the Data Profiler Agent as a tool.
After selecting the database to profile (here a DataStar project named Dairy End-to-End Ada), set the agent to Data Cleanser, write your prompt indicating you want to profile the data (or a subset of it) contained in the connected database. It is recommended to mention the Data Profiler pipeline and wanting to write the results into the database itself:
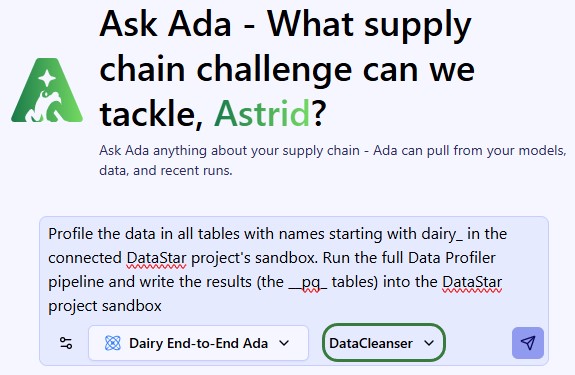
This prompt results in running the full Data Profiler Agent's pipeline and the __pq_ tables can be found in the sandbox of the connected DataStar project.
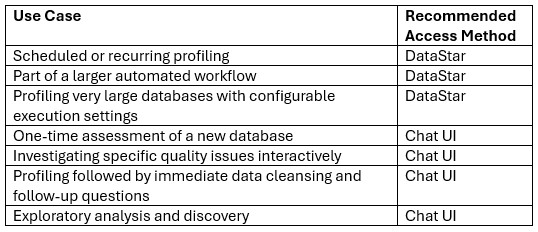
The following table summarizes the most common use cases for the 2 ways of accessing the Data Profiler Agent:
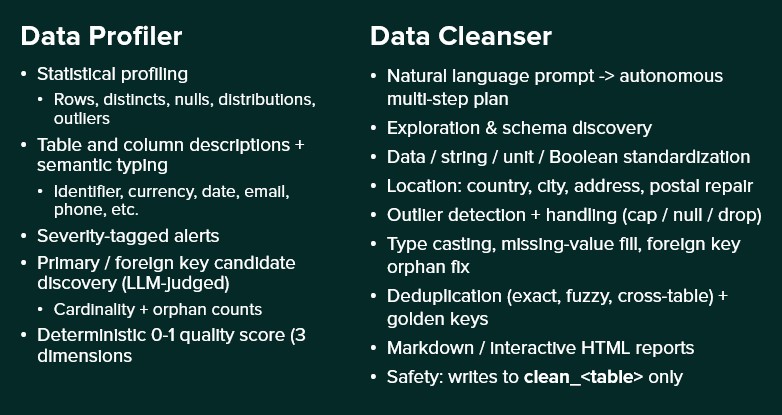
To help you decide if you should use the Data Profiler or Data Cleanser Agent for your task, here is a quick overview of both:
You point the Data Profiler AI Agent at a database, walk away, and come back a few minutes later to a queryable catalogue of every table — what each column means, what type it should be, where the data is broken, how the tables relate, and a single quality score per table to triage what needs cleaning first.
Questions or feedback? Please contact the Optilogic Support team on support@optilogic.com.

The Data Profiler AI Agent is one of Ada's AI-powered assistants, focused on assessing data. It automatically analyzes the quality, structure, and relationships of data stored in an Optilogic database. By profiling every table and column, the agent creates a comprehensive data-quality catalog that helps users understand their data, identify issues, discover relationships, and prioritize cleansing efforts.
The agent can be accessed by chatting with Ada in the next generation Optilogic platform and via Run AI Agent tasks in DataStar.
Understanding the quality and meaning of data is often one of the most time-consuming steps in any analytics, modeling, or optimization project. The Data Profiler AI Agent automates this process by:
The result is a queryable inventory of your data assets, complete with quality assessments and relationship insights.
The Data Profiler AI Agent performs several layers of analysis.
For every table and column, the agent calculates statistical characteristics such as:
For large datasets, the agent uses deterministic sampling to ensure consistent results across profiling runs.
Using LLM-assisted analysis, the agent generates:
These descriptions help users quickly understand the purpose and meaning of data assets.
Based on semantic classifications, the agent recommends appropriate database data types. Examples include:
These recommendations help improve data consistency and prevent issues such as loss of leading zeros in identifiers.
After semantic types are identified, the agent performs specialized validation checks against actual data values. Examples include:
The agent performs dozens of validation checks tailored to the detected semantic type.
Each detected issue is stored as a single row structured alert. Each alert contains:
Notable specialized checks include:
The agent can identify relationships even when keys are not formally defined in the schema.
The discovery process includes
The Data Profiler AI Agent assigns scores ranging from 0.0 to 1.0 across three dimensions:
The overall score is a weighted average, which is capped if data integrity drops too low. Tables without data receive a baseline minimum score, while tables that generate errors display an error stub so users are always aware of the issue.
Measures whether values are:
When the same column name appears in multiple tables with different semantic tags, a majority vote picks one and corrects the outliers.
The only required input is to point the agent to a database. There are several optional inputs which we will cover in the Using the Data Profiler Agent section below.
The output consists of tables written to the database that was profiled:
In addition to database outputs, the agent generates a timestamped execution log, which includes table processing times, alerts, and primary key/foreign key findings. Reviewing the log can help diagnose profiling issues and understand execution performance.
There are two ways to access the Data Profiler Agent:
Both ways will be explained, through DataStar first, then using the chat UI.
Accessing the Data Profiler Agent through DataStar is done via a Run AI Agent task:
In the Configure Utility section of the Configuration tab (from top to bottom):
Note that it is recommended to change the Resource Size from 3XS to XS in the Run Configuration section, since 3XS is usually not sufficient to run the Data Profiler Agent:
While the task is running and after it has completed, the Task Logs tab contains the log file where the user can monitor progress and review key alerts and high-level output summaries:
As an example output, let us have a look at the _dq_table_profiles table:
In this table, the entire executive summary for the customer_returns table is as follows: "The customer_returns table records return events tied to individual sales order lines, supporting analysis of return volumes, reasons, and financial impact. Each record links a return reference return_id to an order_line_id, with return_date providing the time dimension for trend reporting. Operational metrics include return_qty and restock_flag, while refund_amount captures the customer reimbursement value but is stored as text and includes invalid entries. Return reasons are mostly standardized but include missing values and placeholder or corrupted categories, suggesting a need for data cleansing and validation."
It is recommended to be somewhat familiar with Ada and how to talk to her in the chat UI before diving into this content. Please see the Getting Started with Ada & Agentic AI article, and in particular its How to Use Ada section.
Once logged into the next generation Optilogic platform at https://ai.optilogic.app, you can start chatting with Ada and leveraging the Data Profiler Agent right away from the central part of the Home page. You can access it by using the Data Cleanser Agent, as this agent can call the Data Profiler Agent as a tool.
After selecting the database to profile (here a DataStar project named Dairy End-to-End Ada), set the agent to Data Cleanser, write your prompt indicating you want to profile the data (or a subset of it) contained in the connected database. It is recommended to mention the Data Profiler pipeline and wanting to write the results into the database itself:
This prompt results in running the full Data Profiler Agent's pipeline and the __pq_ tables can be found in the sandbox of the connected DataStar project.
The following table summarizes the most common use cases for the 2 ways of accessing the Data Profiler Agent:
To help you decide if you should use the Data Profiler or Data Cleanser Agent for your task, here is a quick overview of both:
You point the Data Profiler AI Agent at a database, walk away, and come back a few minutes later to a queryable catalogue of every table — what each column means, what type it should be, where the data is broken, how the tables relate, and a single quality score per table to triage what needs cleaning first.
Questions or feedback? Please contact the Optilogic Support team on support@optilogic.com.


