Cosmic Frog’s new breakpoints feature enables users to create maps which relay even more supply chain data in just one glance. Lines and points can now be styled based on field values from the underlying input or output table the lines/points are drawn from.
In this Help Center article, we will cover where to find the breakpoints feature for both point and line layers and how to configure them. A basic knowledge of how to configure maps and their layers in Cosmic Frog is assumed; users unfamiliar with maps in Cosmic Frog are encouraged to first read the “Getting Started with Maps” Help Center article.
Using Breakpoints on Line Layers
First, we will walk through how to apply breakpoints to map layers of type = line, which are often used to show flows between locations. With breakpoints we can style the lines between origins and destinations for example based on how much is flowing in terms of quantity, volume or weight. It is also possible to style the lines on other numeric fields, like costs, distances or time.
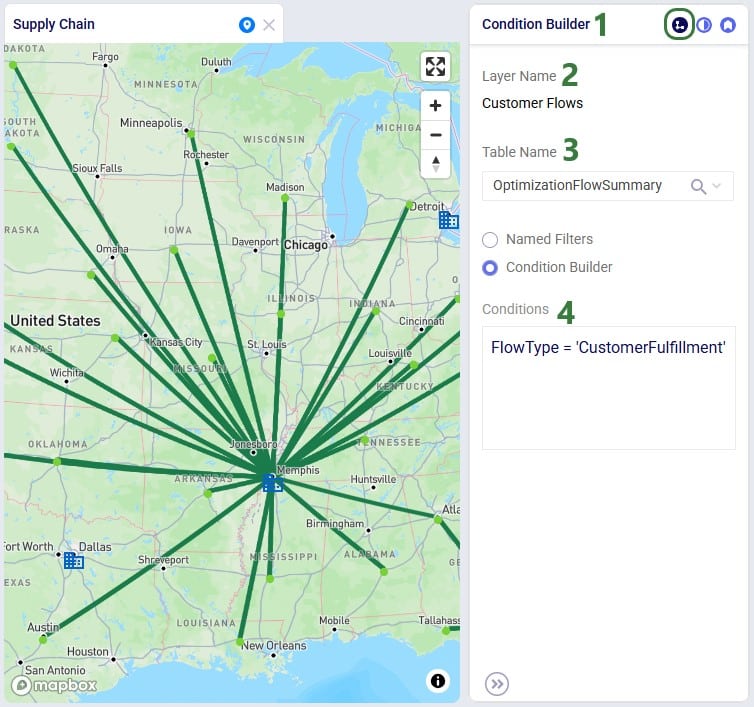
Consider the following map showing flows (dark green lines) to customers (light green circles):
A map layer is selected in the maps & layers list on the left-hand side of the map (not shown in the screenshot). To the right of the map, the Condition Builder pane is open, which is also indicated by the darker blue color of the left icon of the three icons at the right top.
The name of the Layer is Customer Flows.
Under Table Name, user has chosen the Optimization Flow Summary output table from the drop-down list of input and output tables which can be used to draw a map layer from.
In the area where user can apply filters to the table data, the Condition Builder option is selected. The condition that is used (FlowType = ‘CustomerFulfillment’), means that only flows going to customers will be drawn for this layer.
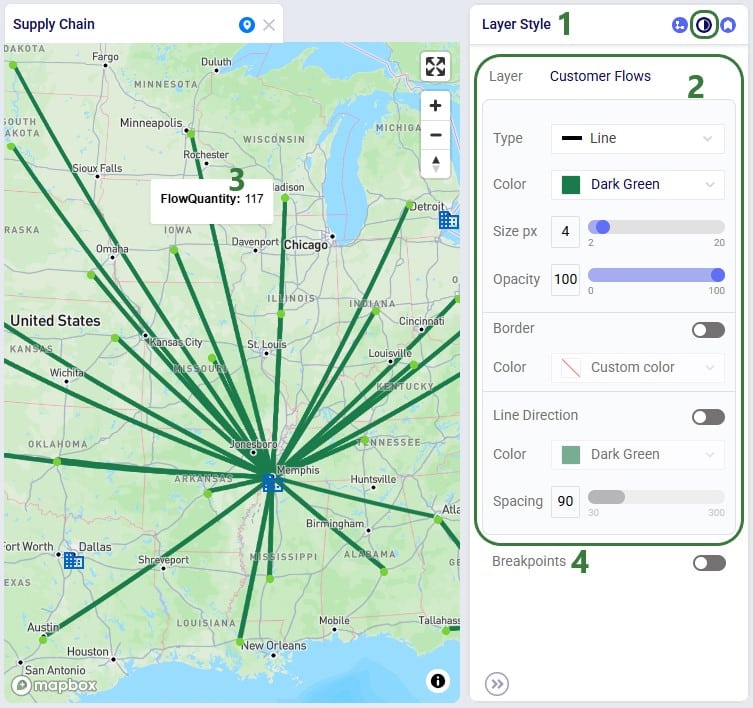
Next, we will go to the Layer Style pane on which breakpoints can be turned on and configured:
We are now on the Layer Style pane of this same Customer Flows layer. While on this pane, the second of the three icons at the top right is a darker blue than the other two, which also indicates the Layer Style pane is the active one.
In the top part of this pane, the style of layer can be configured, including characteristics like color, size, border, and showing line direction. For complete details on what can be configured here, please see the “Layer Style” section in the “Getting Started with Maps” Help Center article. Currently, the lines are styled as a solid dark green line of size 4 and 100% opacity. The lines have no border and line direction (arrowheads indicating the direction of flow from origin to destination) is turned off too.
For this layer, tooltips showing the Flow Quantity when hovering over a flow line have been configured on the Layer Labels pane, the pane that comes up when clicking on the third icon at the top right and described in more detail in the “Layer Labels” section of the Getting Started with Maps article.
At the bottom of the Layer Style pane, Breakpoints can be turned on by sliding the toggle to the right. When it is to the left and grey as it is here, they are turned off.
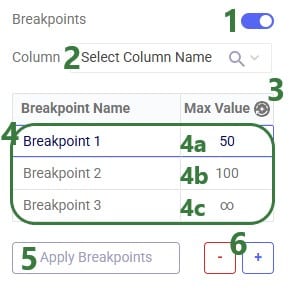
Once the Breakpoints toggle has been turned on (slide right, the color turns blue), the breakpoint configuration options become visible:
The Breakpoints toggle has been slid to the right to turn Breakpoints on.
First, user needs to select a column name from the drop-down list. This list is populated with numerical fields from the table the layer is drawn from. The breakpoint values will be applied to this field to determine which breakpoint a flow falls into and style the line based on the configuration for that particular breakpoint.
Clicking on this circular icon with arrows pointing to each other will automatically populate the breakpoints list with values. How these values are calculated is explained in the next screenshot. A strategy to quickly set up breakpoints is to first auto-generate the breakpoints and then manually finetune them.
There are 3 rows in the Breakpoints table, both the Breakpoint Name and Max Value columns contain defaults. User can use the auto-generate values button explained in the previous bullet to set the Max Values, but they can also be updated manually.
The Breakpoint with the lowest Max Value represents the range of all values less than its Max Value, in this example case 0 – 50 (assuming the field does not contain any negative values, which will be the case for most fields under most conditions).
The second breakpoint represents the range from the Max Value of the first breakpoint to the Max Value of the second breakpoint, which is 50-100 in the example here, etc.
The Max Value of the last breakpoint will always be set to infinity, so the range for this breakpoint equals all values greater than the Max Value of the penultimate breakpoint (> 100 in our example).
Once breakpoints have been configured, user can click on the Apply Breakpoints button to apply them to the map. In the screenshot it is greyed out and unavailable because no Column (bullet 2 above) has been selected yet.
User can remove and add breakpoints by using the minus and plus icons. Please note that:
These options are also available from the context menu that comes up when right-clicking in the Breakpoints table.
To remove multiple breakpoints at the same time, user can select multiple by holding down the Ctrl key when clicking on the breakpoints to remove. Either clicking on the minus button or right-clicking and choosing Delete Breakpoint will remove all selected breakpoints.
The breakpoint with Max Value = infinity cannot be removed.
One additional note is that one can use tab to navigate through the cells in the Breakpoints table.
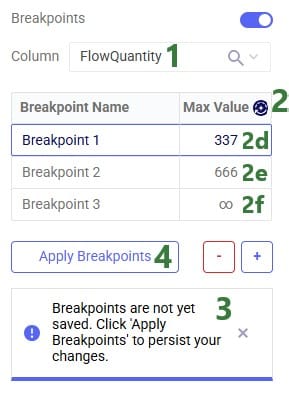
The next screenshot shows breakpoints based on the Flow Quantity field (in the Optimization Flow Summary) for which the Max Values have been auto generated:
We have chosen the Flow Quantity column to base the breakpoints on.
User has clicked on the auto-generate values button to fill out the Max Value field for the first and second breakpoint. The calculations work as follows:
First the minimum value and maximum value of the Flow Quantity field in the Optimization Flow Summary output table are looked up (for the scenario, product(s) and period(s) selected for the map, and the condition(s) applied to the layer). In our case these are: minimum value = 9 and maximum value = 994.
Next, the absolute difference between the max and min values is calculated: ABS(994 – 9) = 985.
Since we have 3 breakpoints, the interval for the breakpoints is calculated as the absolute difference between the max and min values divided by the number of breakpoints: 985/3 = 328.33.
The Max Value for the first breakpoint is the min value plus the interval = 9 + 328.33 = 337.33, which when rounded to 0 decimal points results in 337.
The Max Value for the second breakpoint is the Max Value of the first breakpoint plus the interval = 337.33 + 328.33 = 665.66, which when rounded to 0 decimal points results in 666.
The last breakpoint is always set to infinity.
Just setting Max Values for the breakpoints does not yet apply them to the map, a message reminding the user of this is shown at the bottom. The message can be removed by clicking on the x on the right-hand side.
Now that a column has been selected, the Apply Breakpoints button is available. Once clicked, the map will update and now looks as follows:
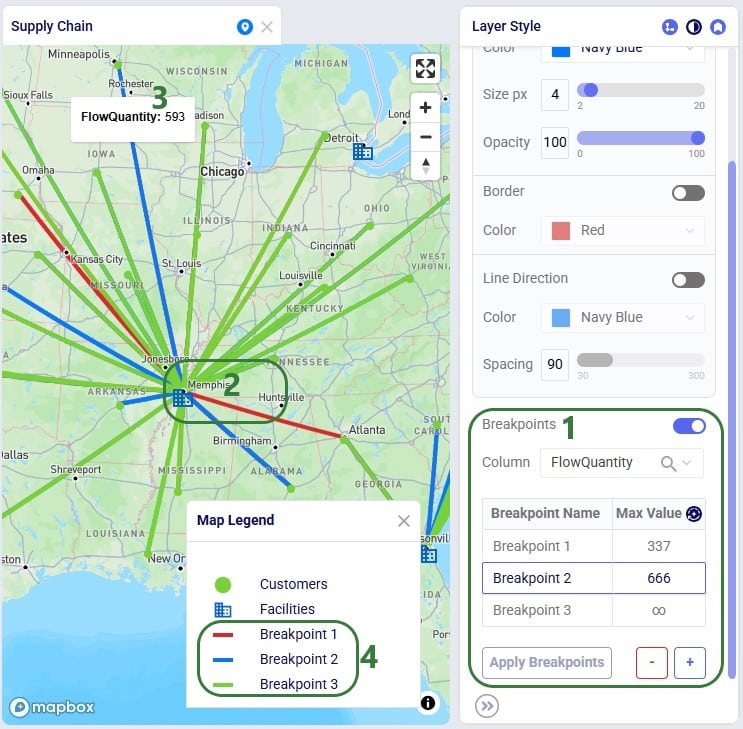
The configuration of the Flow Quantity breakpoints as we have just seen in the previous screenshot.
On the map we now see that the flow lines are no longer dark green, but either red, blue or bright green. These are the default colors used for breakpoints, we will cover how to update colors and other styling of the flows for different breakpoints next.
We are hovering over a blue flow line which shows the Flow Quantity in the tooltip as 593. Looking at the breakpoint values, this is in the range of the second breakpoint (337-666), and therefore it is colored blue.
The legend also indicates the breakpoint names and their colors.
Users can customize the style of each individual breakpoint:
User selects the first breakpoint to make some changes to. First, they update the name of the breakpoint to be more descriptive, so that it becomes apparent when looking at the Map Legend what type of layer it is and what value range the breakpoint represents. The breakpoint name now indicates that it is on a layer that shows customer flows (‘CustFlow…’), and the 0-337 is the value range associated with this first breakpoint.
Instead of the default color of red for the first breakpoint, user changes it to dark orange.
User also wants to apply a dark green border to the lines of this breakpoint, so the slider is moved to the right and the color is changed. As this is the last change for the breakpoints user wants to make for now, they can go ahead and apply the changes. This is done by either clicking on the Apply Breakpoints button or putting the cursor in one of the breakpoint rows and hitting Enter.
On the map, we see a couple of flows that were previously colored red that have now become orange with a green border. We are hovering over 1 of them and see that the Flow Quantity of 301 as shown in the tooltip indeed falls within the range of the first breakpoint.
The breakpoint name has been updated in the Map Legend, so that it is now easier for a user to understand what the breakpoint represents.
Please note:
As mentioned under bullet 3 above, applying breakpoint changes is done by either clicking the Apply Breakpoints button or by putting the cursor in one of the breakpoints in the breakpoints table and hitting Enter.
Making multiple changes for different breakpoints without applying them in between is fine to do. Just hit Enter / click on Apply Breakpoints after putting the cursor in the Breakpoints table to apply all breakpoint changes.
Breakpoint configurations are persisted: if breakpoints have been turned on and configured and then turned off, the same configuration will be applied when turned on again.
Using Breakpoints on Point Layers
Configuring and applying breakpoints on point layers is very similar to those on line layers. We will walk through the steps in the next 4 screenshots in slightly less detail. In this example we will base the size of the customer locations on the map on the total demand they have been served:
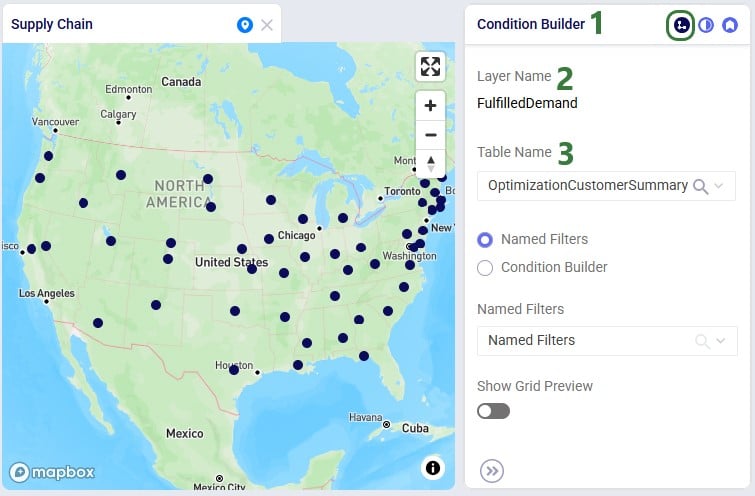
Again, we start on the Condition Builder pane of the active layer.
This layer is named FulfilledDemand.
The Optimization Customer Summary output table is used to draw this layer.
Next, we again look at the Layer Style pane of the layer:
We are on the Layer Style pane.
The customers that are being shown on the map have been configured to be blue black circle with a size of 6 pixels and 100% opacity.
We have also configured the Layer Labels pane (can be opened by clicking the third icon at the right top) to show tooltips with the Total Served Demand Quantity. The Total Served Demand Quantity of the customer we are hovering over at the moment is 2,274.
At the bottom of the Layer Style pane we can turn on Breakpoints, which is what user does next:
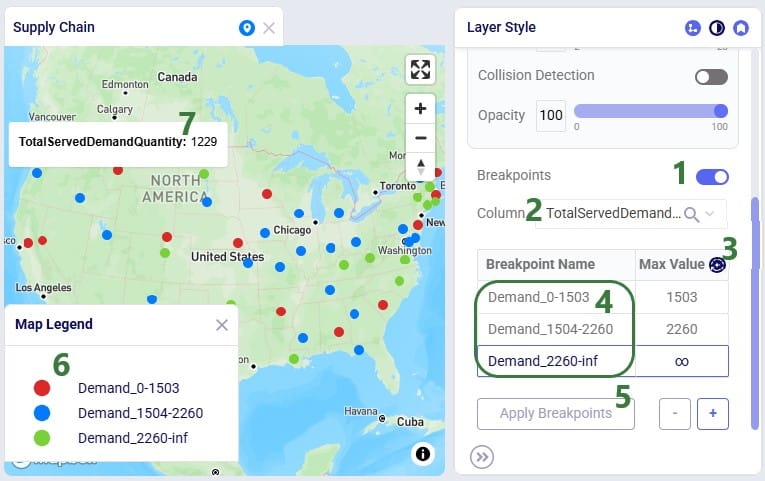
The breakpoints toggle has been slid to the right to turn breakpoints on for this layer.
The column we want to base the breakpoints on is the Total Served Demand Quantity.
User uses the auto-generate values button to set the max values of the 3 breakpoints, their values are calculated as 1,503, 2,260, and infinity.
The breakpoint names have been updated to be more descriptive of what the layer shows and what the value ranges of the different breakpoints are.
After updating the breakpoint names, used has clicked the Apply Breakpoints button, which has updated the map.
We see that the customers on the map have changed from the black blue color to red, blue, and bright green based on which breakpoint value range they fall into.
Hovering over a red customer shows that its Total Served Demand Quantity is 1,229, which indeed falls into the value range of the first breakpoint named Demand_0-1503.
Lastly, user would like to gradually increase the color of the customer circles from light to dark green and the size from small to bigger based on the breakpoint the customer belongs to:
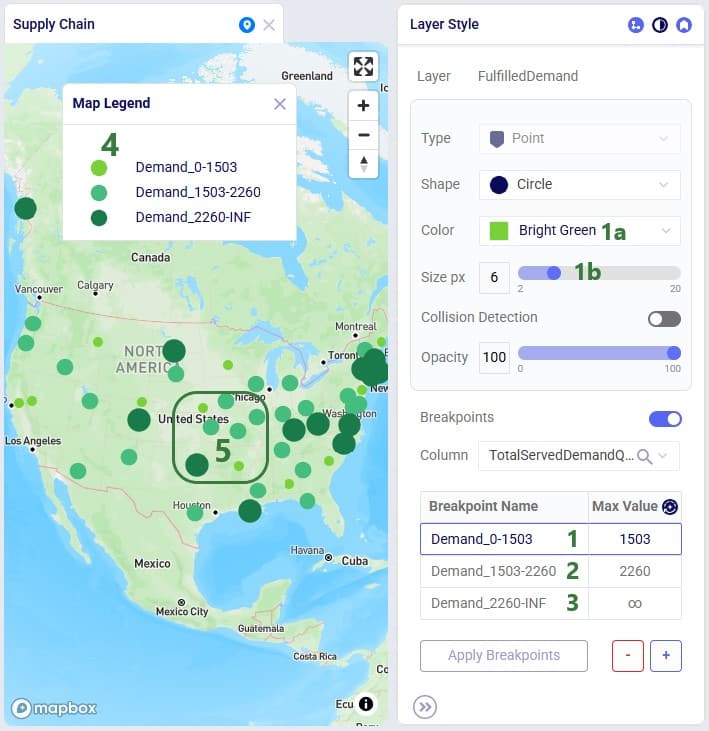
User has selected the first breakpoint in the breakpoints table, and updates the color and size:
Bright Green is chosen as the Color for this first breakpoint.
The size is set to 6 pixels.
User then moves onto the second breakpoint and updates its color and size to Pale Green and 10 pixels, respectively.
Finally, user selects the third breakpoint and sets the color to Dark Green and the size to 14 pixels. They then apply the breakpoints to update the map.
After applying the breakpoint changes, we see the updated Map Legend reflects the color changes of the customers.
On the map itself, we see that both the color and size changes have been applied and now we can quickly see which customers have the highest demand (larger, darker circles) and which the lowest (smaller, lighter circles).
As always, please feel free to reach out to Optilogic support at support@optilogic.com should you have any questions.
Cosmic Frog’s new breakpoints feature enables users to create maps which relay even more supply chain data in just one glance. Lines and points can now be styled based on field values from the underlying input or output table the lines/points are drawn from.
In this Help Center article, we will cover where to find the breakpoints feature for both point and line layers and how to configure them. A basic knowledge of how to configure maps and their layers in Cosmic Frog is assumed; users unfamiliar with maps in Cosmic Frog are encouraged to first read the “Getting Started with Maps” Help Center article.
Using Breakpoints on Line Layers
First, we will walk through how to apply breakpoints to map layers of type = line, which are often used to show flows between locations. With breakpoints we can style the lines between origins and destinations for example based on how much is flowing in terms of quantity, volume or weight. It is also possible to style the lines on other numeric fields, like costs, distances or time.
Consider the following map showing flows (dark green lines) to customers (light green circles):
A map layer is selected in the maps & layers list on the left-hand side of the map (not shown in the screenshot). To the right of the map, the Condition Builder pane is open, which is also indicated by the darker blue color of the left icon of the three icons at the right top.
The name of the Layer is Customer Flows.
Under Table Name, user has chosen the Optimization Flow Summary output table from the drop-down list of input and output tables which can be used to draw a map layer from.
In the area where user can apply filters to the table data, the Condition Builder option is selected. The condition that is used (FlowType = ‘CustomerFulfillment’), means that only flows going to customers will be drawn for this layer.
Next, we will go to the Layer Style pane on which breakpoints can be turned on and configured:
We are now on the Layer Style pane of this same Customer Flows layer. While on this pane, the second of the three icons at the top right is a darker blue than the other two, which also indicates the Layer Style pane is the active one.
In the top part of this pane, the style of layer can be configured, including characteristics like color, size, border, and showing line direction. For complete details on what can be configured here, please see the “Layer Style” section in the “Getting Started with Maps” Help Center article. Currently, the lines are styled as a solid dark green line of size 4 and 100% opacity. The lines have no border and line direction (arrowheads indicating the direction of flow from origin to destination) is turned off too.
For this layer, tooltips showing the Flow Quantity when hovering over a flow line have been configured on the Layer Labels pane, the pane that comes up when clicking on the third icon at the top right and described in more detail in the “Layer Labels” section of the Getting Started with Maps article.
At the bottom of the Layer Style pane, Breakpoints can be turned on by sliding the toggle to the right. When it is to the left and grey as it is here, they are turned off.
Once the Breakpoints toggle has been turned on (slide right, the color turns blue), the breakpoint configuration options become visible:
The Breakpoints toggle has been slid to the right to turn Breakpoints on.
First, user needs to select a column name from the drop-down list. This list is populated with numerical fields from the table the layer is drawn from. The breakpoint values will be applied to this field to determine which breakpoint a flow falls into and style the line based on the configuration for that particular breakpoint.
Clicking on this circular icon with arrows pointing to each other will automatically populate the breakpoints list with values. How these values are calculated is explained in the next screenshot. A strategy to quickly set up breakpoints is to first auto-generate the breakpoints and then manually finetune them.
There are 3 rows in the Breakpoints table, both the Breakpoint Name and Max Value columns contain defaults. User can use the auto-generate values button explained in the previous bullet to set the Max Values, but they can also be updated manually.
The Breakpoint with the lowest Max Value represents the range of all values less than its Max Value, in this example case 0 – 50 (assuming the field does not contain any negative values, which will be the case for most fields under most conditions).
The second breakpoint represents the range from the Max Value of the first breakpoint to the Max Value of the second breakpoint, which is 50-100 in the example here, etc.
The Max Value of the last breakpoint will always be set to infinity, so the range for this breakpoint equals all values greater than the Max Value of the penultimate breakpoint (> 100 in our example).
Once breakpoints have been configured, user can click on the Apply Breakpoints button to apply them to the map. In the screenshot it is greyed out and unavailable because no Column (bullet 2 above) has been selected yet.
User can remove and add breakpoints by using the minus and plus icons. Please note that:
These options are also available from the context menu that comes up when right-clicking in the Breakpoints table.
To remove multiple breakpoints at the same time, user can select multiple by holding down the Ctrl key when clicking on the breakpoints to remove. Either clicking on the minus button or right-clicking and choosing Delete Breakpoint will remove all selected breakpoints.
The breakpoint with Max Value = infinity cannot be removed.
One additional note is that one can use tab to navigate through the cells in the Breakpoints table.
The next screenshot shows breakpoints based on the Flow Quantity field (in the Optimization Flow Summary) for which the Max Values have been auto generated:
We have chosen the Flow Quantity column to base the breakpoints on.
User has clicked on the auto-generate values button to fill out the Max Value field for the first and second breakpoint. The calculations work as follows:
First the minimum value and maximum value of the Flow Quantity field in the Optimization Flow Summary output table are looked up (for the scenario, product(s) and period(s) selected for the map, and the condition(s) applied to the layer). In our case these are: minimum value = 9 and maximum value = 994.
Next, the absolute difference between the max and min values is calculated: ABS(994 – 9) = 985.
Since we have 3 breakpoints, the interval for the breakpoints is calculated as the absolute difference between the max and min values divided by the number of breakpoints: 985/3 = 328.33.
The Max Value for the first breakpoint is the min value plus the interval = 9 + 328.33 = 337.33, which when rounded to 0 decimal points results in 337.
The Max Value for the second breakpoint is the Max Value of the first breakpoint plus the interval = 337.33 + 328.33 = 665.66, which when rounded to 0 decimal points results in 666.
The last breakpoint is always set to infinity.
Just setting Max Values for the breakpoints does not yet apply them to the map, a message reminding the user of this is shown at the bottom. The message can be removed by clicking on the x on the right-hand side.
Now that a column has been selected, the Apply Breakpoints button is available. Once clicked, the map will update and now looks as follows:
The configuration of the Flow Quantity breakpoints as we have just seen in the previous screenshot.
On the map we now see that the flow lines are no longer dark green, but either red, blue or bright green. These are the default colors used for breakpoints, we will cover how to update colors and other styling of the flows for different breakpoints next.
We are hovering over a blue flow line which shows the Flow Quantity in the tooltip as 593. Looking at the breakpoint values, this is in the range of the second breakpoint (337-666), and therefore it is colored blue.
The legend also indicates the breakpoint names and their colors.
Users can customize the style of each individual breakpoint:
User selects the first breakpoint to make some changes to. First, they update the name of the breakpoint to be more descriptive, so that it becomes apparent when looking at the Map Legend what type of layer it is and what value range the breakpoint represents. The breakpoint name now indicates that it is on a layer that shows customer flows (‘CustFlow…’), and the 0-337 is the value range associated with this first breakpoint.
Instead of the default color of red for the first breakpoint, user changes it to dark orange.
User also wants to apply a dark green border to the lines of this breakpoint, so the slider is moved to the right and the color is changed. As this is the last change for the breakpoints user wants to make for now, they can go ahead and apply the changes. This is done by either clicking on the Apply Breakpoints button or putting the cursor in one of the breakpoint rows and hitting Enter.
On the map, we see a couple of flows that were previously colored red that have now become orange with a green border. We are hovering over 1 of them and see that the Flow Quantity of 301 as shown in the tooltip indeed falls within the range of the first breakpoint.
The breakpoint name has been updated in the Map Legend, so that it is now easier for a user to understand what the breakpoint represents.
Please note:
As mentioned under bullet 3 above, applying breakpoint changes is done by either clicking the Apply Breakpoints button or by putting the cursor in one of the breakpoints in the breakpoints table and hitting Enter.
Making multiple changes for different breakpoints without applying them in between is fine to do. Just hit Enter / click on Apply Breakpoints after putting the cursor in the Breakpoints table to apply all breakpoint changes.
Breakpoint configurations are persisted: if breakpoints have been turned on and configured and then turned off, the same configuration will be applied when turned on again.
Using Breakpoints on Point Layers
Configuring and applying breakpoints on point layers is very similar to those on line layers. We will walk through the steps in the next 4 screenshots in slightly less detail. In this example we will base the size of the customer locations on the map on the total demand they have been served:
Again, we start on the Condition Builder pane of the active layer.
This layer is named FulfilledDemand.
The Optimization Customer Summary output table is used to draw this layer.
Next, we again look at the Layer Style pane of the layer:
We are on the Layer Style pane.
The customers that are being shown on the map have been configured to be blue black circle with a size of 6 pixels and 100% opacity.
We have also configured the Layer Labels pane (can be opened by clicking the third icon at the right top) to show tooltips with the Total Served Demand Quantity. The Total Served Demand Quantity of the customer we are hovering over at the moment is 2,274.
At the bottom of the Layer Style pane we can turn on Breakpoints, which is what user does next:
The breakpoints toggle has been slid to the right to turn breakpoints on for this layer.
The column we want to base the breakpoints on is the Total Served Demand Quantity.
User uses the auto-generate values button to set the max values of the 3 breakpoints, their values are calculated as 1,503, 2,260, and infinity.
The breakpoint names have been updated to be more descriptive of what the layer shows and what the value ranges of the different breakpoints are.
After updating the breakpoint names, used has clicked the Apply Breakpoints button, which has updated the map.
We see that the customers on the map have changed from the black blue color to red, blue, and bright green based on which breakpoint value range they fall into.
Hovering over a red customer shows that its Total Served Demand Quantity is 1,229, which indeed falls into the value range of the first breakpoint named Demand_0-1503.
Lastly, user would like to gradually increase the color of the customer circles from light to dark green and the size from small to bigger based on the breakpoint the customer belongs to:
User has selected the first breakpoint in the breakpoints table, and updates the color and size:
Bright Green is chosen as the Color for this first breakpoint.
The size is set to 6 pixels.
User then moves onto the second breakpoint and updates its color and size to Pale Green and 10 pixels, respectively.
Finally, user selects the third breakpoint and sets the color to Dark Green and the size to 14 pixels. They then apply the breakpoints to update the map.
After applying the breakpoint changes, we see the updated Map Legend reflects the color changes of the customers.
On the map itself, we see that both the color and size changes have been applied and now we can quickly see which customers have the highest demand (larger, darker circles) and which the lowest (smaller, lighter circles).
As always, please feel free to reach out to Optilogic support at support@optilogic.com should you have any questions.