

When running Cosmic Frog models and other jobs on the Optilogic platform, cloud resources are used. Usage of these resources is billed based on the billing factor of the resource used for the job. Each Optilogic customer has an amount of cloud compute hours included in their Master License Agreement (MLA). Users may want to check how many of these hours have been used up and in this documentation 2 ways to do so will be covered. In the last section we will touch on how to best track hours at the team/company level.
The first option for hours tracking that will be covered is through the Usage tab in the user’s Account:
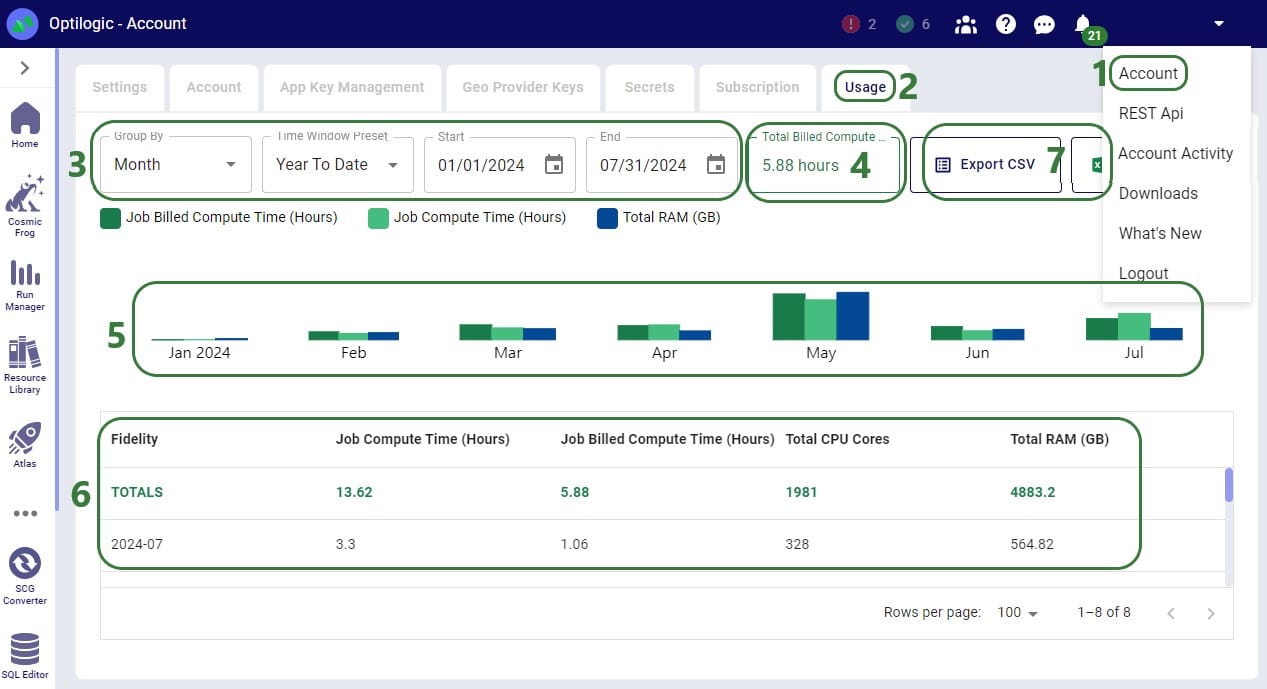
If a user is asked by their manager to report the hours they have used on the Optilogic platform, they can go here and use the Custom Time Window Preset option to align the start and end date of the reporting period with the dates of the MLA. They can then report back the number shown as the Total Billed Compute Time (box 4 in the above screenshot).
Through the Run Manager application on the Optilogic platform, user can also analyze their jobs run, including retrieving the Total Billed Compute Time:
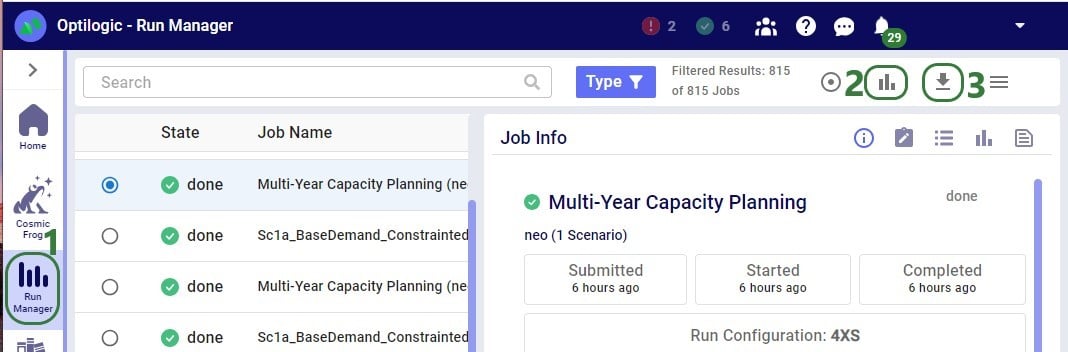
After clicking on the View Charts icon, a screen similar to the following screenshot will be shown:


If a user needs to report their hours used on the Optilogic platform, they can download this jobs.csv file and:
Currently, only tracking of usage hours at the individual user level is available as described above. To get total team or company usage, a manager can ask their users to use 1 of the above 2 methods to report their Total Billed Compute Time and the manager can then add these up to get the total used hours so far. Tracking at the team/company level is planned to be made available on the Optilogic platform later in 2024.
When running Cosmic Frog models and other jobs on the Optilogic platform, cloud resources are used. Usage of these resources is billed based on the billing factor of the resource used for the job. Each Optilogic customer has an amount of cloud compute hours included in their Master License Agreement (MLA). Users may want to check how many of these hours have been used up and in this documentation 2 ways to do so will be covered. In the last section we will touch on how to best track hours at the team/company level.
The first option for hours tracking that will be covered is through the Usage tab in the user’s Account:
If a user is asked by their manager to report the hours they have used on the Optilogic platform, they can go here and use the Custom Time Window Preset option to align the start and end date of the reporting period with the dates of the MLA. They can then report back the number shown as the Total Billed Compute Time (box 4 in the above screenshot).
Through the Run Manager application on the Optilogic platform, user can also analyze their jobs run, including retrieving the Total Billed Compute Time:
After clicking on the View Charts icon, a screen similar to the following screenshot will be shown:
If a user needs to report their hours used on the Optilogic platform, they can download this jobs.csv file and:
Currently, only tracking of usage hours at the individual user level is available as described above. To get total team or company usage, a manager can ask their users to use 1 of the above 2 methods to report their Total Billed Compute Time and the manager can then add these up to get the total used hours so far. Tracking at the team/company level is planned to be made available on the Optilogic platform later in 2024.


