

Leapfrog helps Cosmic Frog users explore and use their model data via natural language. View data, make changes, create & run scenarios, analyze outputs, learn all about the Anura schema that underlies Cosmic Frog models, and a whole lot more!
Leapfrog combines an extensive knowledge of PostgreSQL with the complete knowledge of Optilogic’s Anura data schema, and all the natural language capabilities of today’s advanced general purpose LLMs.
For a high-level overview and short video introducing Leapfrog, please see the Leapfrog landing page on Optilogic’s website.
In this documentation, we will first get users oriented on where to find Leapfrog and how to interact with it. In the section after, Leapfrog’s capabilities will be listed out with examples of each. Next, the Tips & Tricks section will give users helpful pointers so they can get the most out of Leapfrog. Finally, we will step through the process of building, running, and analyzing a Cosmic Frog model start to finish by only using Leapfrog!
Dive in if you’re ready to take the leap!
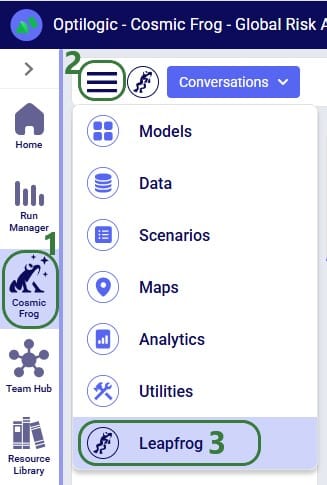
Start using Leapfrog by opening the module within Cosmic Frog:
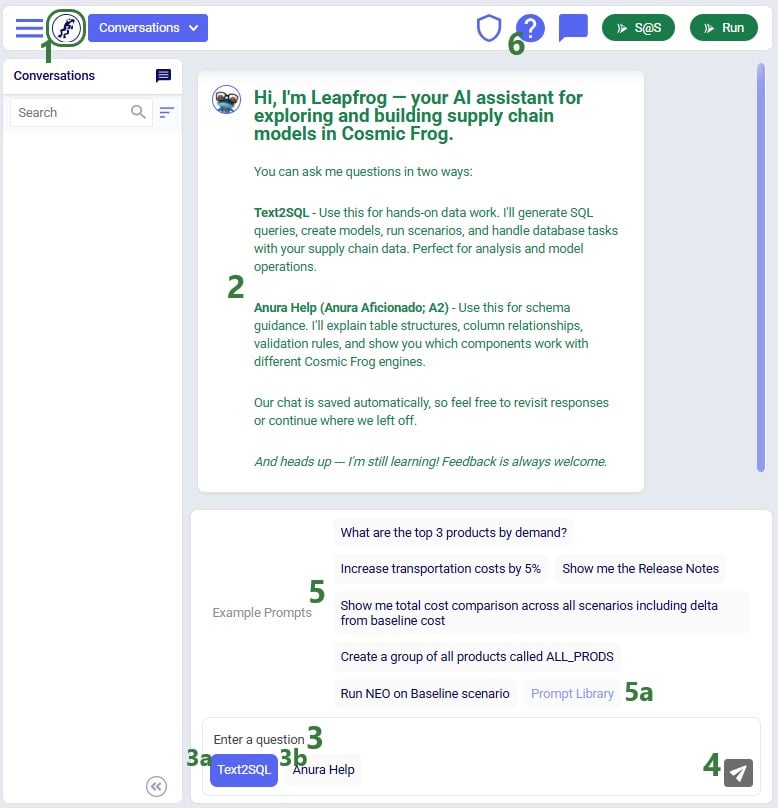
Once the Leapfrog module is open, users’ screens will look similar to the following screenshot:
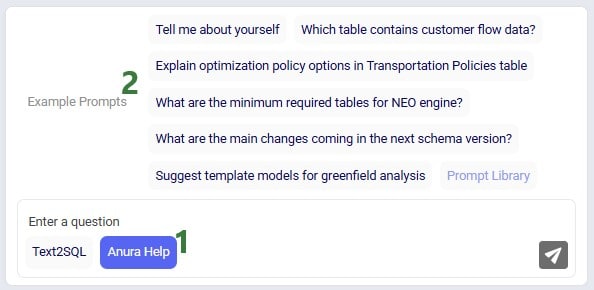
The example prompts when using the Anura Help LLM are shown here:
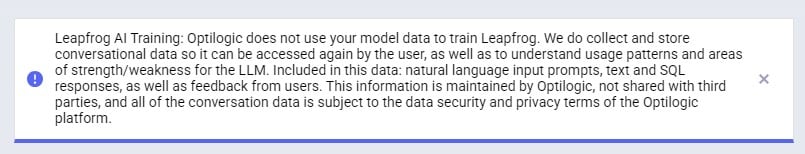
When first starting to use Leapfrog, users will also see the Privacy and Data Security statement, which reads as follows:
“Leapfrog AI Training: Optilogic does not use your model data to train Leapfrog. We do collect and store conversational data so it can be accessed again by the user, as well as to understand usage patterns and areas of strength/weakness for the LLM. Included in this data: natural language input prompts, text and SQL responses, as well as feedback from users. This information is maintained by Optilogic, not shared with third parties, and all of the conversation data is subject to the data security and privacy terms of the Optilogic platform.”
This message will stay visible within Leapfrog whenever it is being used, unless user clicks on the grey cross button on the right to close the message. Once closed, the message will not be shown again while using Leapfrog.
Conversation history is stored on the platform at the user level - not in the model database - so it does not get shared when a model is shared. Note that if you are working in a Team rather than in your My Account (see documentation on Teams on the Optilogic platform here), the Leapfrog conversations you are creating will be available to the other team members when they are working with the same model.
As mentioned in the previous section, Leapfrog currently makes use of 2 large language models (LLMs): Text2SQL and Anura Help (also referred to as Anura Aficionado or A2). They will be explained in some more detail here. There is also an appendix to this documentation where for a few example personas Leapfrog questions and responses are listed, which showcases how some users may predominantly use one model, while others may switch back and forth between them. Of course, when unsure, users can try a specific prompt using both LLMs to see which provides the most helpful response.
Please note that in future users will not need to indicate which LLM they want to run a prompt against as Leapfrog will recognize which one will be most suitable to use based on the prompt.
The Text2SQL LLM combines extensive knowledge of PostgreSQL with Optilogic’s Anura data schema, and all the natural language capabilities of today’s advanced general purpose LLMs. It has been further fine-tuned on a large set of prompt-response pairs hand-crafted by supply chain modeling experts. This allows the Text2SQL model to generate SQL queries from natural language prompts.
Prompts for which it is best to use the Text2SQL model often imply an action: “Show me X”, “Add Y”, “Delete Z”, “Run scenario A”, “Create B”, etc. See also the example prompts listed when starting a new conversation and those in the Prompt Library on the Frogger Pond community.
Leapfrog responses using this model are usually actionable: run the returned SQL query to add / edit / delete data, create a scenario or model, run a scenario, geocode locations, etc.
A full list of the capabilities of both LLMs is covered in the section “Leapfrog Capabilities” further below.
Anura Help (also referred to as Anura Aficionado or A2) is a specialized assistant that leverages advanced natural language processing to help users navigate and understand the Anura schema within Optilogic's Cosmic Frog application. The Anura schema is the foundational framework powering Cosmic Frog's optimization, simulation, and risk assessment capabilities. Anura Help eliminates traditional barriers to schema understanding by providing immediate, authoritative guidance for supply chain modelers, developers, and analysts.
Anura Help’s architecture uses the Retrieval Augmented Generation (RAG) approach: based on the natural language prompt, first the most relevant documents of those in its knowledge base are retrieved (e.g. schema details or engine awareness details). Next, it uses them to generate a natural language response.
Use the Anura Help model when wanting to learn about specific fields, tables or engines in Cosmic Frog. Its core capabilities include:
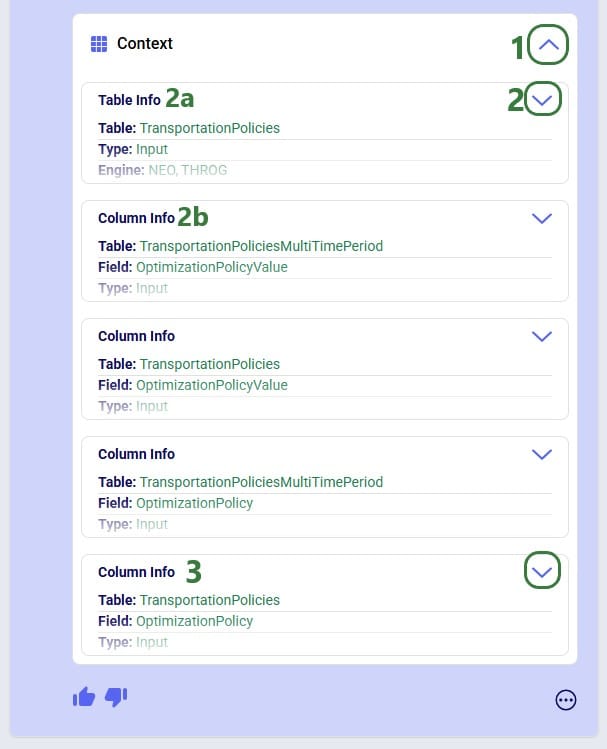
Responses from Leapfrog when using the Anura Help model are text-based and generated from retrieved documents shown in the context section. This context can for example be of the category “column info” where all details for a specific field are listed.
A full list of the capabilities of both LLMs is covered in the section “Leapfrog Capabilities” further below.
The following list compares the 2 LLMs available in Leapfrog today:
Depending on the type of question, Leapfrog’s response to it can take different forms: text, links, SQL queries, data grids, and options to create models, scenarios, scenario items, groups, run scenarios, or geocode locations. We will look at several examples of questions that result in these different types of responses in this section. This is not an exhaustive list; the next section “Leapfrog Capabilities” will go through the types of prompt-response pairs Leapfrog is capable of today.
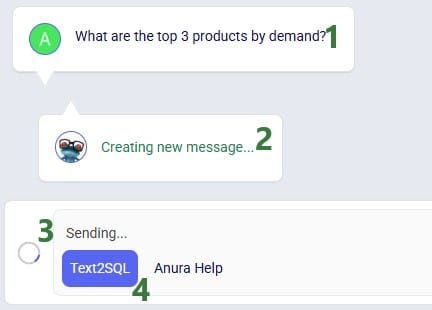
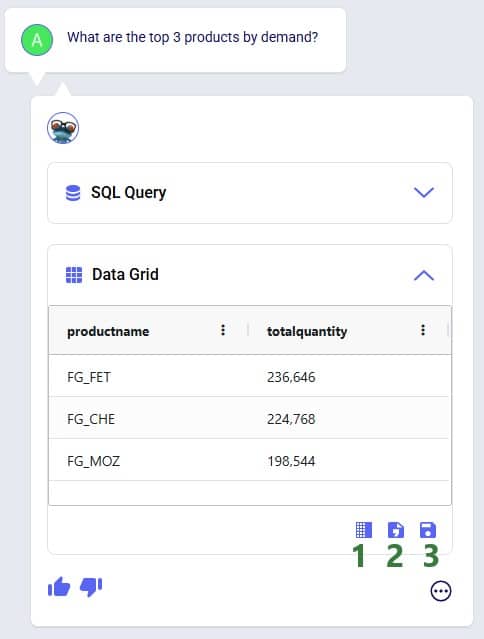
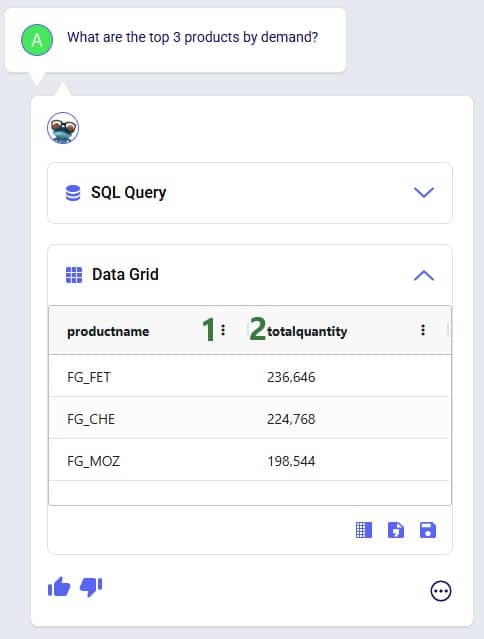
For our first question, we used the first Text2SQL example prompt “What are the top 3 products by demand?” by clicking on it. After submitting the prompt, we see that Leapfrog is busy formulating a response:
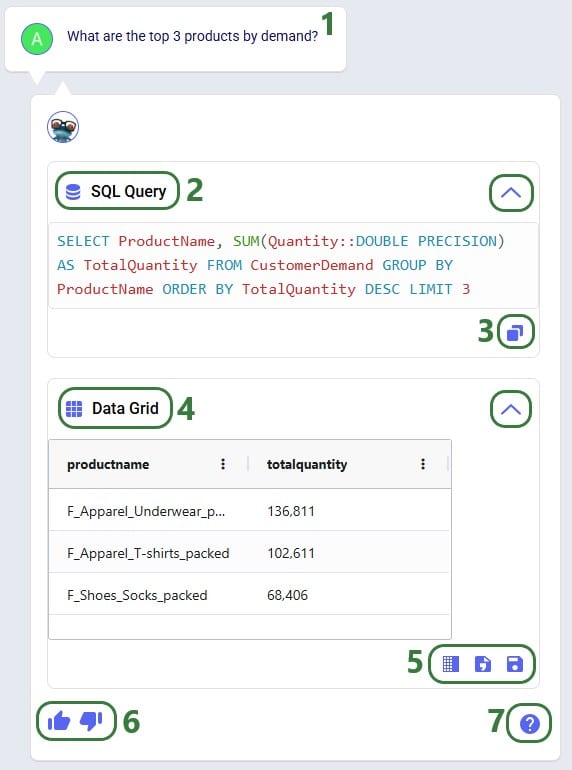
And Leapfrog’s response to the prompt is as follows:
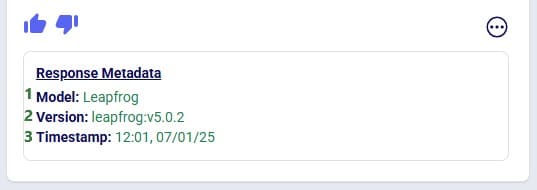
The metadata included here are:
Clicking on the icon with 3 dots again will collapse the response metadata.
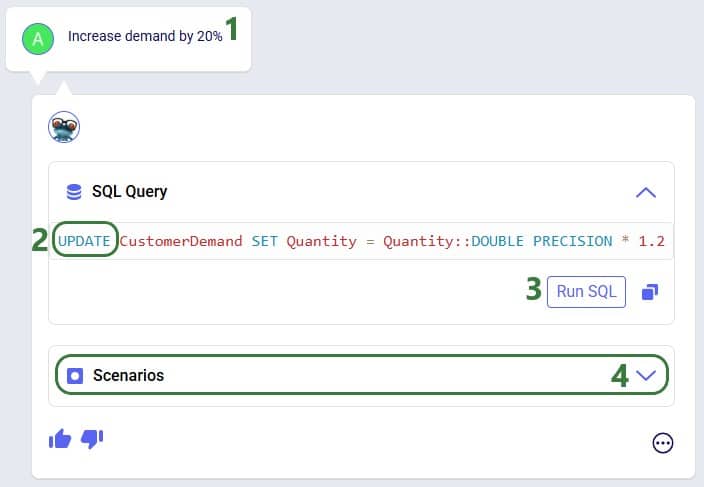
This first prompt asked a question about the input data contained in the Cosmic Frog model. Let us now look at a slightly different type of prompt, which asks to change model input:
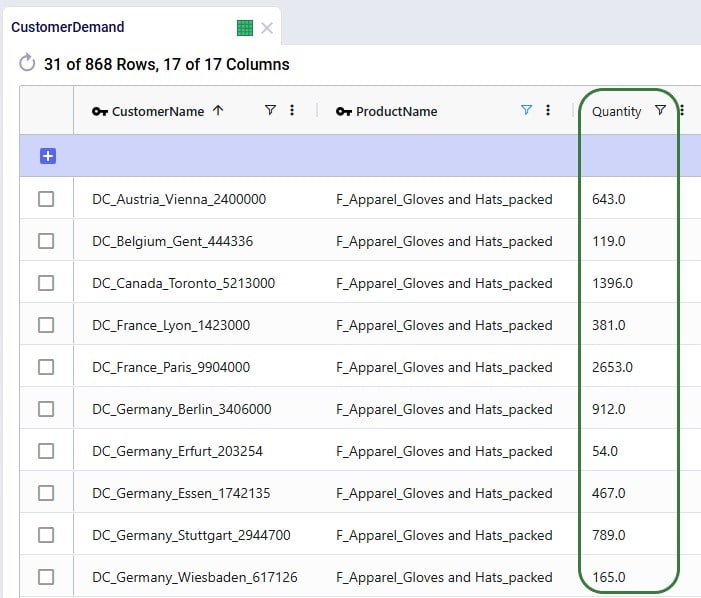
We are going to run the SQL query of the above response to our “Increase demand by 20%” prompt. Before doing so, let’s review a subset of 10 records of the Customer Demand input table (under the Data Module, in the Input Tables section):
Next, we will run the SQL query:
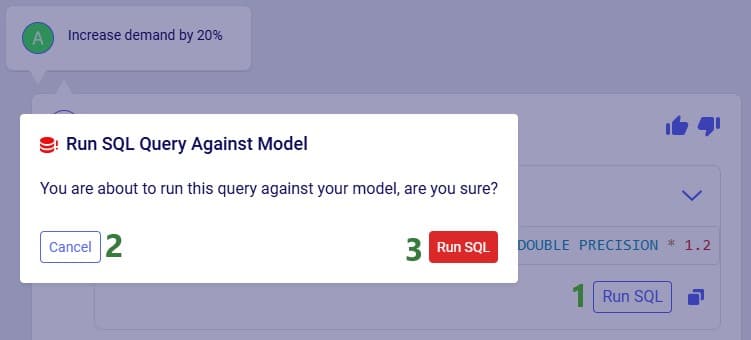
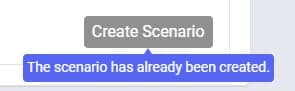
After clicking the Run SQL button at the bottom of the SQL Query section in Leapfrog’s response, it becomes greyed out so it will not accidentally be run again. Hovering over the button also shows text indicating the query was already run:
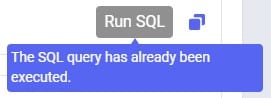
Note that closing and reopening the model or refreshing the browser will revert the Run SQL button’s state so it is clickable again.
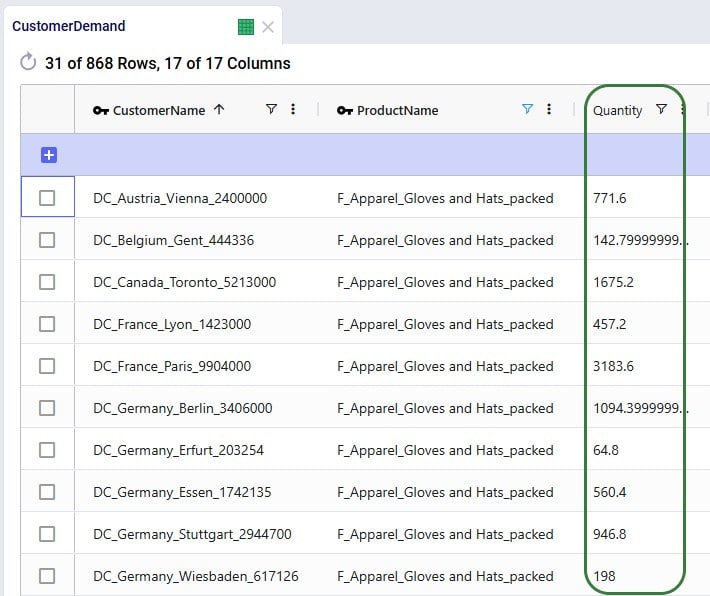
Opening the Customer Demand table again and looking at the same 10 records, we see that the Quantity field has indeed been changed to its previous value multiplied by 1.2 (the first record’s value was 643, and 643 * 1.2 = 771.6, etc.):
Running the SQL query to increase the demand by 20% directly in the master data worked fine as we just saw. However, if we do not want to change the master data, but rather want to increase the demand quantity as part of a scenario, this is possible too:
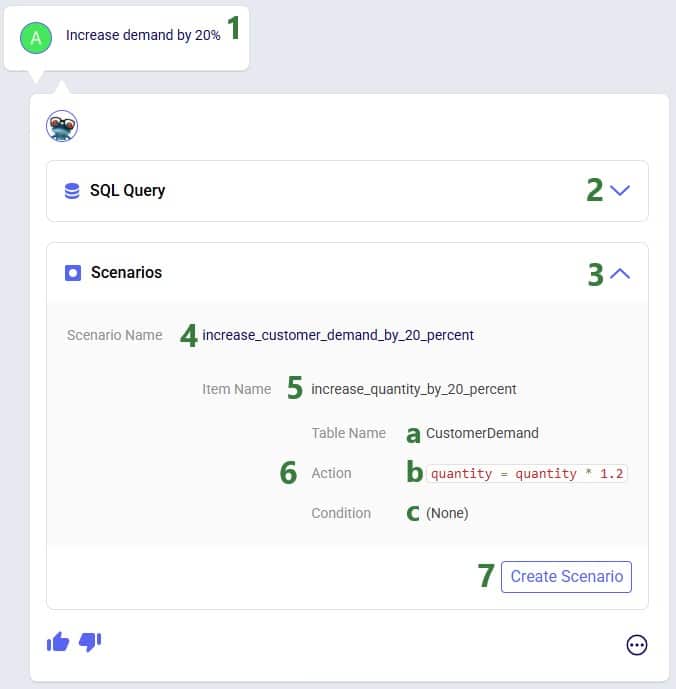
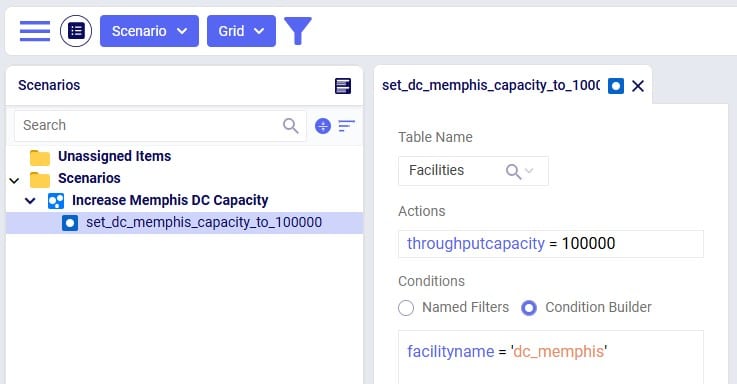
After navigating to the Scenarios module within our Cosmic Frog model, we can see the scenario and its item have been created:
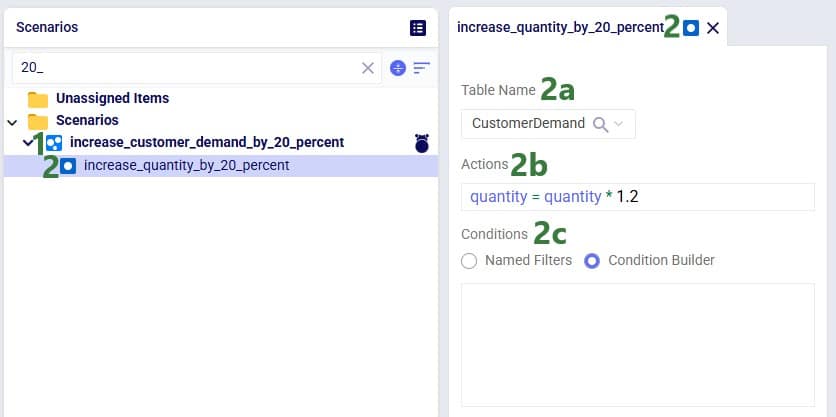
Note that if desired, the scenario and scenario item names auto-generated by Leapfrog can be changed in the Scenarios module of Cosmic Frog: just select the scenario or item and then choose “Rename” from the Scenario drop-down list at the top.
As a final example of a question & answer pair in this section, let us look at one where we use the Anura Help LLM, and Leapfrog responds with text plus context:
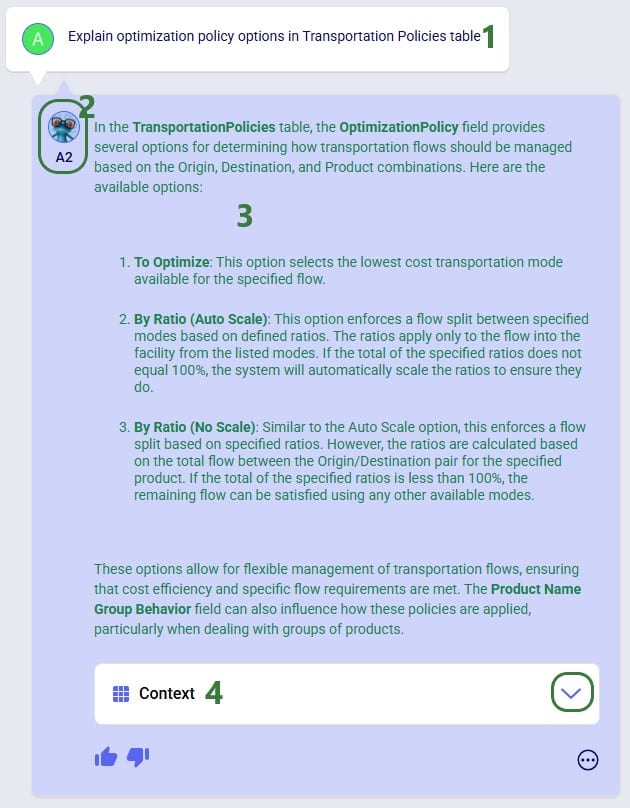
There is a lot of information listed here; we will explain the most commonly used information:
Prompts and their responses are organized into conversations in the Leapfrog module:
Users can organize their conversations with Leapfrog by using the options from the Conversations drop-down at the top of the Leapfrog module:
Users can rate Leapfrog responses by clicking on the thumbs up (like) and thumbs down (dislike) buttons and, optionally, providing additional feedback. This feedback is used to continuously improve Leapfrog. Giving a thumbs up to indicate the response is what you expected helps reinforce correct answers from Leapfrog. When a response is not what was expected or wrong, users can help improve Leapfrog’s underlying LLMs by giving the response a thumbs down. Especially thumbs down ratings & additional feedback will be reviewed so Leapfrog can learn and become more useful all the time.
When a response is not as expected as was the case in the following screenshot, user is encouraged to click the thumbs down button:

After clicking on the Send button, the detailed feedback is automatically added to the conversation:

The next screenshot shows an example where user gave Leapfrog’s response a thumbs up as it was what user expected. This feedback can then be used by Leapfrog to reinforce correct answers. User also had the option to provide detailed feedback again, using any of the following 4 optional tags: Showcase Example, Surprising, Fun, and Repeatable Use Case. In this example, user decided not to give detailed feedback and clicked on the Close button after the detailed feedback form came up:
If you have any additional Leapfrog feedback (or questions) beyond what can be captured here, you can feel free to send an email to Leapfrog@Optilogic.com. You are also very welcome to ask questions, share your experiences, and provide feedback on Leapfrog in the Frogger Pond Community.
We will now go back to our first prompt “What are the top 3 products by demand” to explore some of the options users have when Data Grids are included in a Leapfrog response, which is the case when Leapfrog’s SQL Query response is a SELECT statement.


When clicking on the Download File button, a zip file with the name of the active Cosmic Frog model appended with an ID, is downloaded to the user’s Downloads folder. The zip contains:
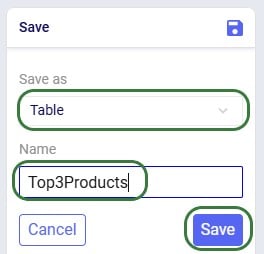
After clicking on Save, following message appears beneath the Data Grid in Leapfrog’s response:

Looking in the Custom Tables section (#2 in screenshot below) of the Data module (#1 in screenshot below), we indeed see this newly created table named top3products (#3 in screenshot below) with the same contents as the Data Grid of the Leapfrog response:

If we choose to save the Data Grid as a view instead of a table, it goes as follows:
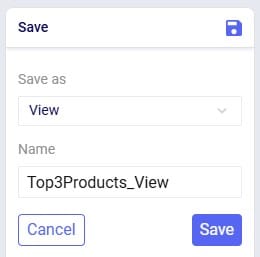
We choose Save as View and give it the name of Top3Products_View. The message that comes up once the view is created reads as follows:

Going to the Analytics module in Cosmic Frog, choosing to add a new dashboard and in this new dashboard a new visualization, we can find the top3products_view in the Views section:

We will go back to the original Data Grid in Leapfrog’s response to explore a few more options user has here:
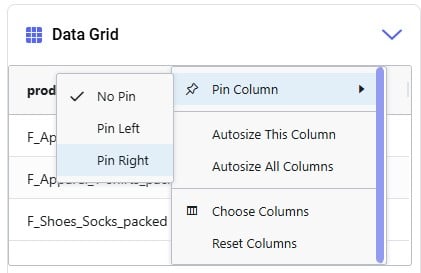
Please note:
In this section we will list out what Leapfrog is capable of and give examples of each capability. These capabilities include (the LLM each capability applies to is listed in parentheses):
Each of these capabilities will be discussed in the following sections, where a brief description of each capability is given, several example prompts illustrating the capability are listed, and a few screenshots showing the capability are included as well. Please remember that many more example prompts can be found in the Prompt Library on the Frogger Pond community.
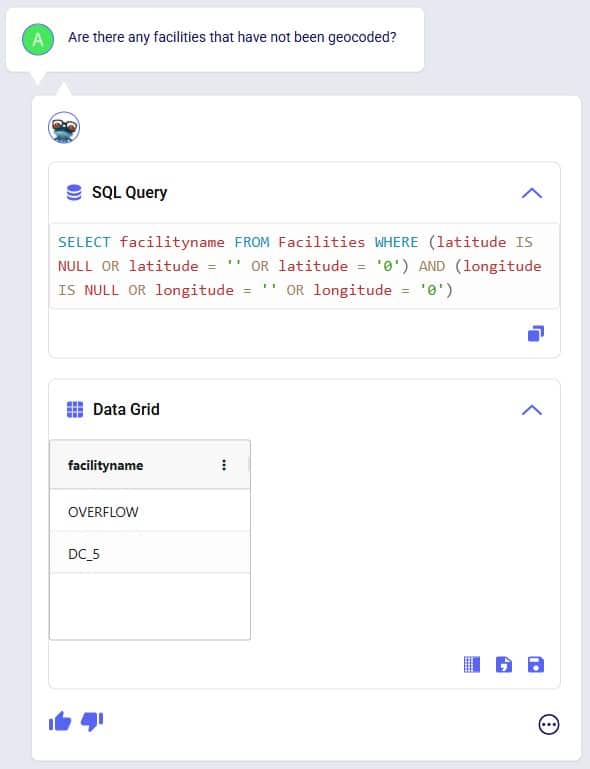
Interrogate input and output data using natural language. Use it to check completeness of input data, and to summarize input and/or output data. Leapfrog responds with SELECT Statements and shows a Data Grid preview as we have seen above. Export the data grid or save it as a table or view for further use, which has been covered above already too.
Example prompts:
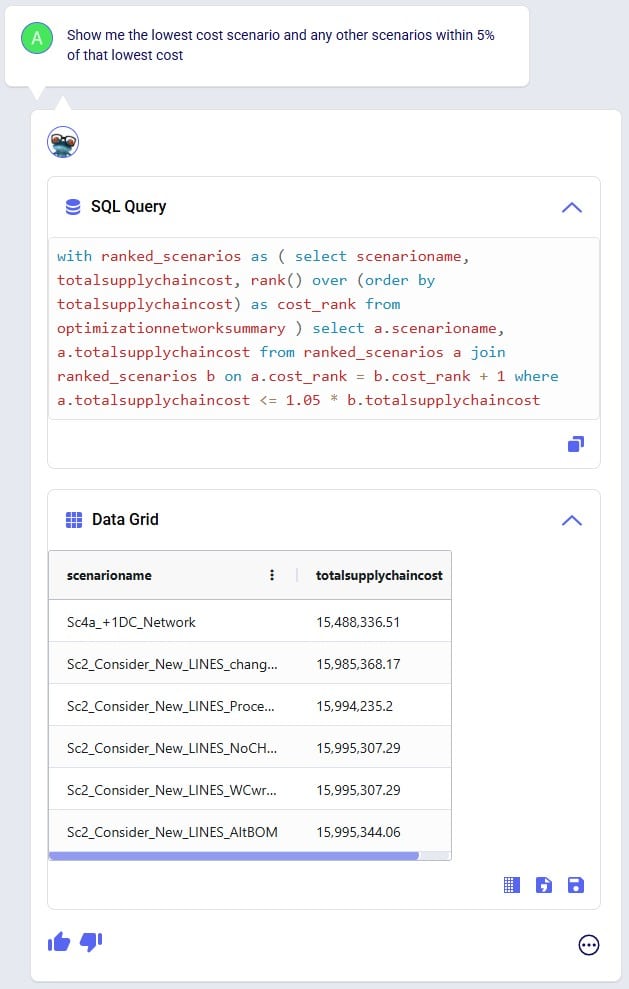
The following 3 screenshots show examples of checking input data (first screenshot), and interrogating output data (second and third screenshot):
Tell Leapfrog what you want to edit in the input data of your Cosmic Frog model, and it will respond with UPDATE, INSERT, and DELETE SQL Statements. User can opt to run these SQL Queries to permanently make the change in the master input data. For UPDATE SQL Queries, Leapfrog’s response will also include the option to create a scenario and scenario item that will make the change, which we will focus on in the next section.
Example prompts:
The following 3 screenshots show examples changing values in the input data (first screenshot), adding records to an input table (second screenshot), and deleting records from an input table (third screenshot):
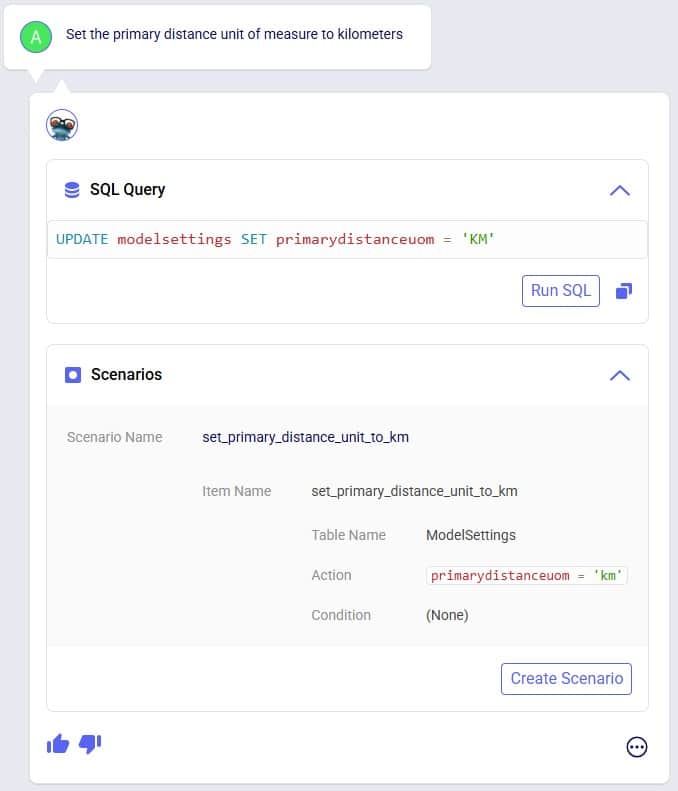
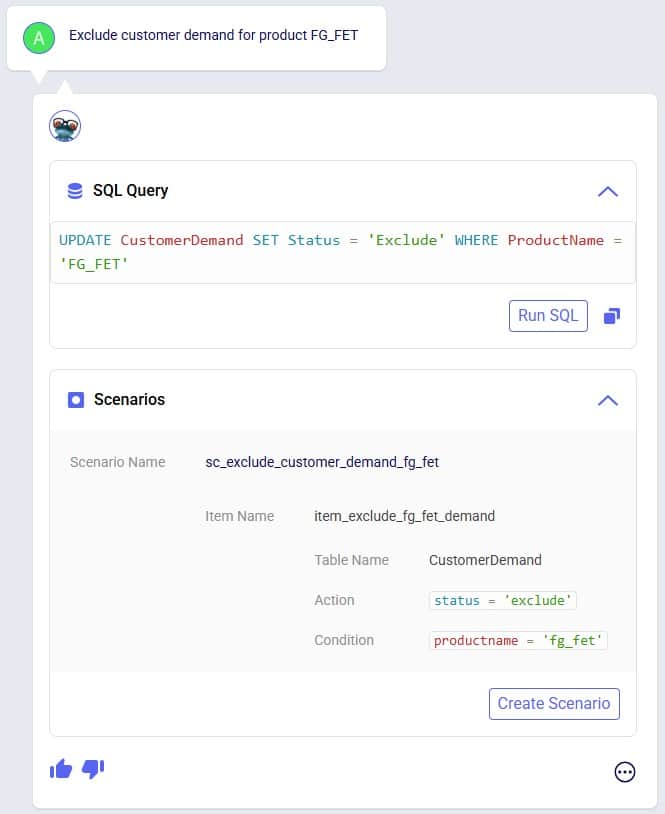
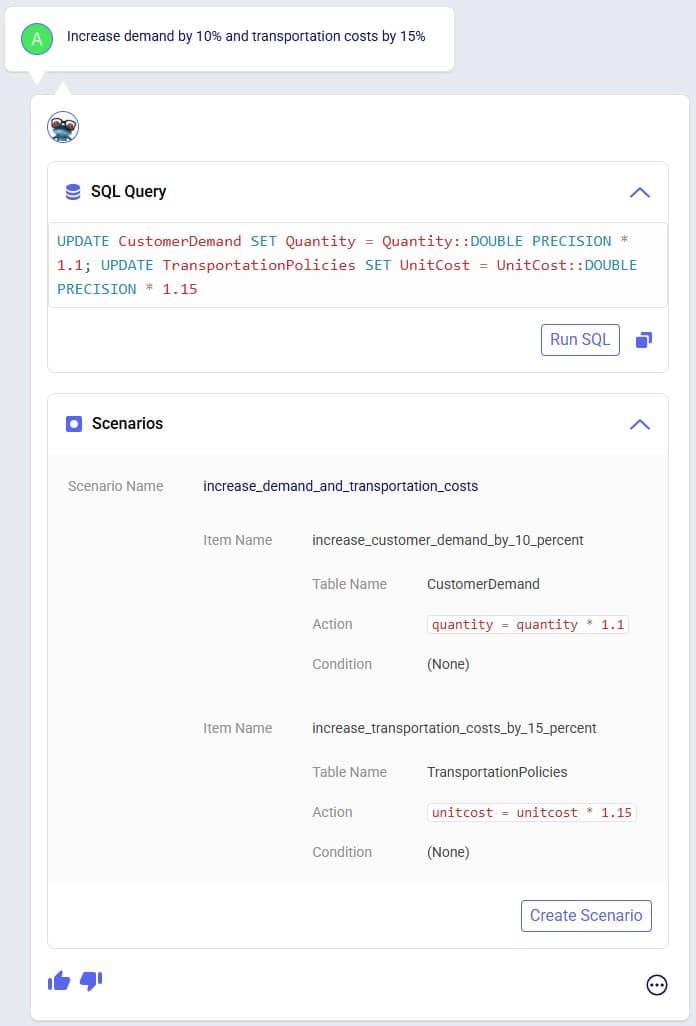
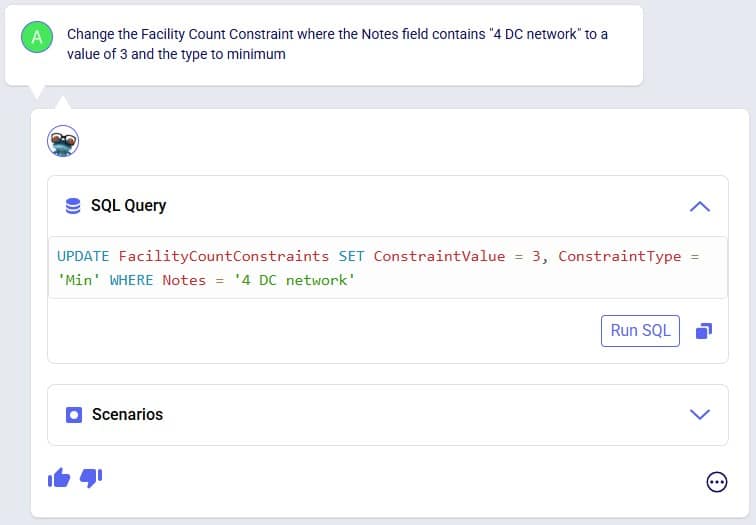
Make changes to input data, but through scenarios rather than updating the master tables directly. Prompts that result in UPDATE SQL Queries will have a Scenarios part in their responses and users can easily create a new scenario that will make the input data change by one click of a button.
Example prompts:
The following 3 screenshots show example prompts with responses from which scenarios can be created: create a scenario which makes a change to all records in 1 input table (first screenshot), create a scenario which makes a change to records in 1 input table that match a condition (second screenshot), and create a scenario that makes changes in 2 input tables (third screenshot):
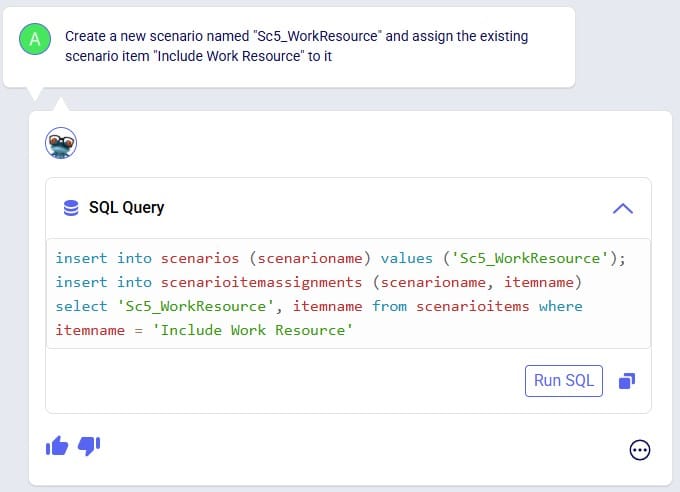
The above screenshots show examples of Leapfrog responses that contain a Scenarios section and from which new scenarios and scenario items can be created by clicking on the Create Scenario button. In addition to the above, users can also use Leapfrog to manage scenarios by using prompts that specifically create scenarios and/or items and assigning specific scenario items to specific scenarios. These result in INSERT INTO SQL Statements which can then be implemented by using the Run SQL button. See the following 2 screenshots for examples of this, where 1) a new scenario is created and an existing scenario item is then assigned to it, and 2) a new scenario item is created which is then assigned to an already existing scenario:
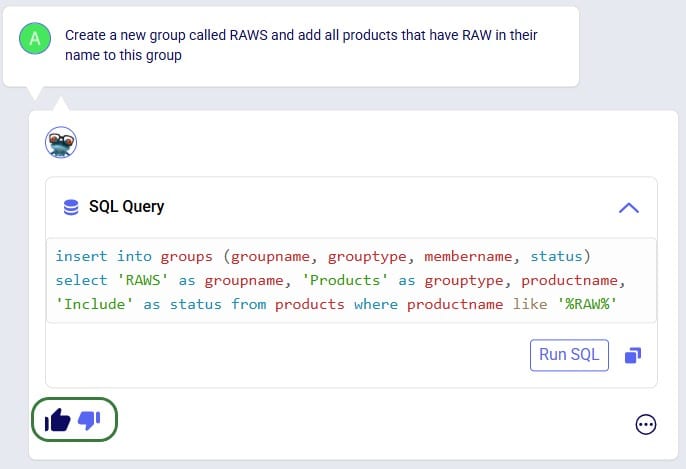
Leapfrog can create new groups and add group members to new and existing groups. Just specify the group name and which members it needs to have in the prompt and Leapfrog’s response will be one or multiple INSERT INTO SQL Statements.
Example prompts:
The following 4 screenshots show example prompts of creating groups and group members: 1) creates a new products group and adds products that have names with a certain prefix (FG_) to it, 2) creates a new periods group and adds 3 specific periods to it, 3) creates a new suppliers group and adds all suppliers that are located in China to it, and 4) adds a new member to an existing facilities group, and in addition explicitly sets the Status and Notes field of this new record in the Groups table:

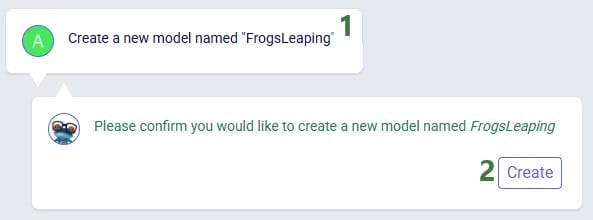
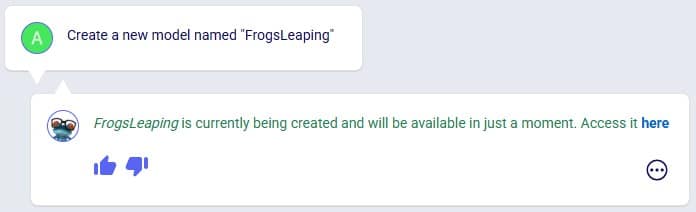
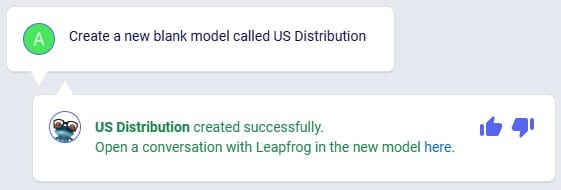
Leapfrog can create a new, blank model. Leapfrog's response will ask user to confirm if they want to create the new model before creating it. If confirmed, the response will update to contain a link which takes user to the Leapfrog module in this newly created model in a new tab of the browser.
Example prompts:
Following 2 screenshots show an example where a new model named “FrogsLeaping” is created:
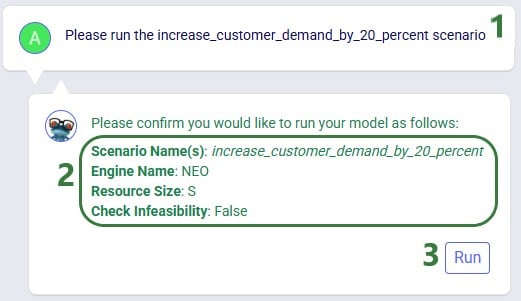
You can ask Leapfrog to kick off any model runs for you. Optionally you can specify the scenario(s) you want to be run, which engine to use, and what resource size to use. For Neo (network optimization) runs, user can additionally indicate if the infeasibility check should be turned on. If no scenario(s) are specified, all scenarios present in the model will be run. If no engine is specified, the Neo engine (network optimization) will be used. If no resource size is specified, S will be used. If for Neo runs it is not specified if the infeasibility check should be turned on or off it will be off by default.
Leapfrog’s response will summarize the scenario(s) that are to be run, the engine that will be used, the resource size that will be used, and for Neo runs if the infeasibility check will be on or off. If user indeed wants to run the scenario(s) with these settings, they can confirm by clicking on the Run button. If so, the response will change to contain a link to the Run Manager application on Optilogic’s platform, which will be opened in a new tab of the browser when clicked. In the Run Manager, users can monitor the progress of any model runs.
The engines available in Cosmic Frog are:
The resource sizes available are as follows, from smallest to largest: Mini, 4XS, 3XS, 2XS, XS, S, M, L, XL, 2XL, 3XL, 4XL, Overkill. Guidance on choosing a resource size can be found here.
Example prompts:
The following 2 screenshots show an example prompt where the response is to run the model: only the scenario name is specified in which case a network optimization (Neo) is run using resource size S with the infeasibility check turned off (False):
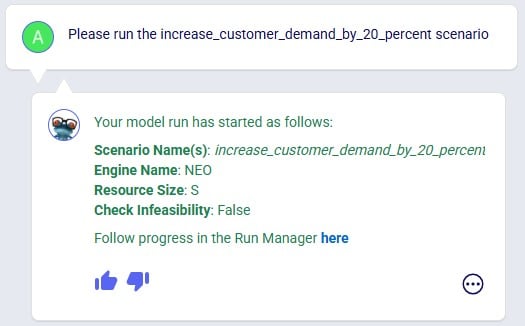
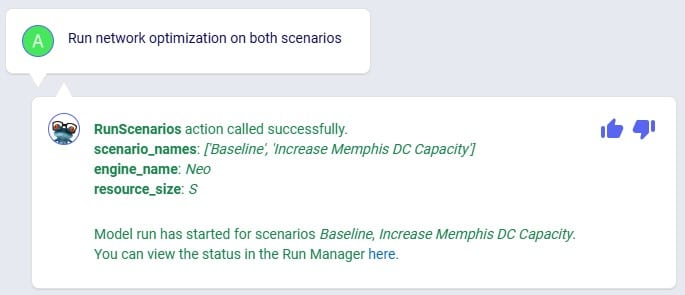
Leapfrog's response now indicates the run has been kicked off and provides a link (click on the word "here") to check the progress of the scenario run(s) in the Run Manager.
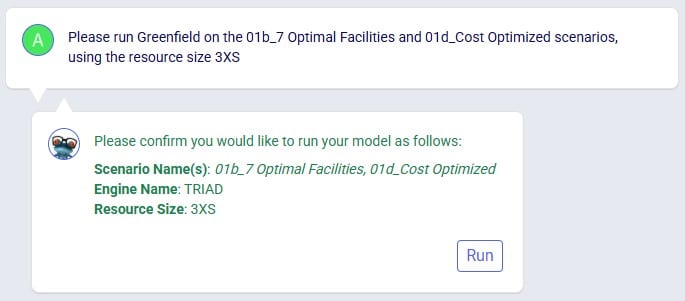
The next screenshot shows a prompt asking to specifically run Greenfield (Triad) on 2 scenarios, where the resource size to be used is specified in the prompt too:
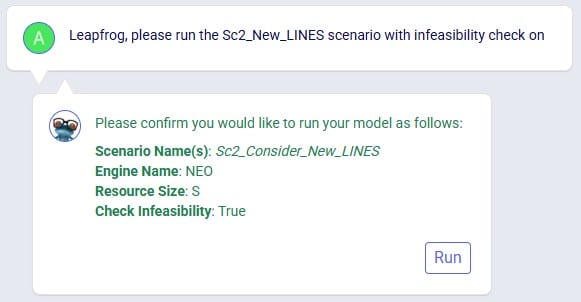
The last screenshot in this section shows a prompt to run a specific scenario with the infeasibility check turned on:
Leapfrog can find latitude & longitude pairs for locations (customers, facilities, and suppliers) based on the location information specified in these input tables (e.g. Address, City, Region, Country). Leapfrog’s response will ask user to confirm they want to geocode the specified table(s). If so, the response will change to contain a link which will open a Cosmic Frog map showing the locations that have been geocoded in a new tab of the browser.
Example prompts:
Notes on using Leapfrog for geocoding locations:
In the following screenshot, user asks Leapfrog to geocode customers:
As geocoding a larger set of locations can take some time, it may look like the geocoding was not done or done incompletely if looking at the map or in the Customers / Facilities / Suppliers input tables shortly after kicking off the geocoding. A helpful tool which shows the progress of the geocoding (and other tools / utilities within Cosmic Frog) is the Model Activity list:
Leapfrog can teach users all about the Anura schema that underlies Cosmic Frog models, including:
Example prompts:
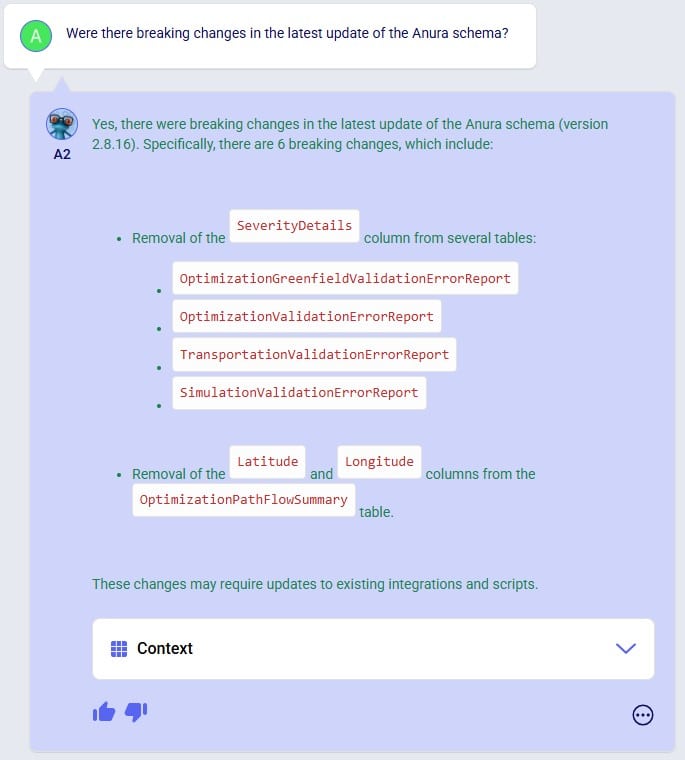
The following 4 screenshots show examples of these types of prompts & Leapfrog’s responses: 1) ask Leapfrog to teach us about a specific field on a specific table, 2) find out which table to use for a specific modelling construct, 3) understand the SCG to Cosmic Frog’s Anura mapping for a specific field on a specific table, and 4) ask about breaking changes in the latest Anura schema update:
Anura Help provides information around system integration, which includes:
Example prompts:
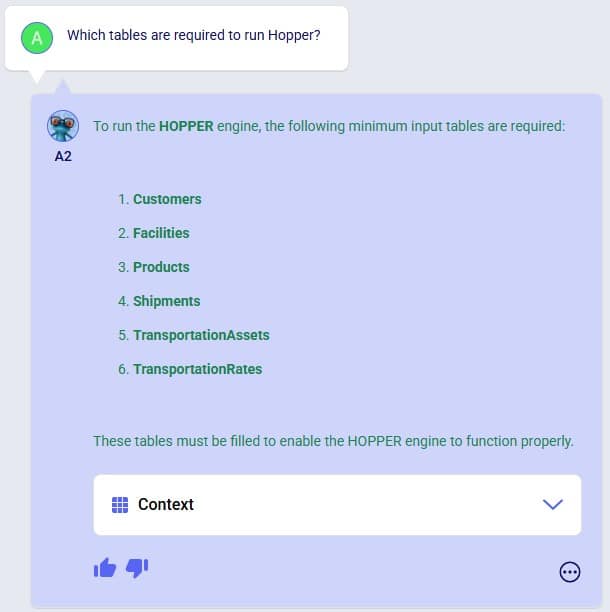
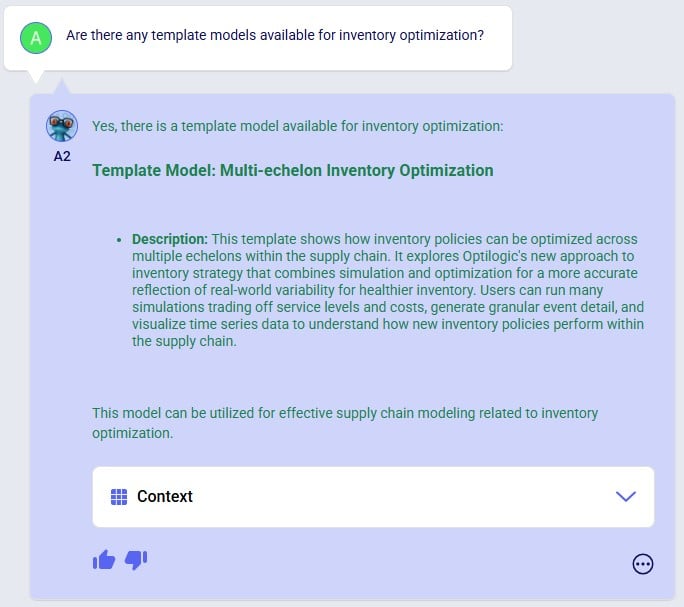
The following 4 screenshots show examples of these types of prompts & Leapfrog’s responses: 1) ask which tables are required to run a specific engine, 2) find out which engines use a specific table, 3) learn which table contains a certain type of outputs, and 4) ask about availability of template models for a specific purpose:


Leapfrog knows about itself, Optilogic, Cosmic Frog, the Anura database schema, LLM’s, and more. Ask Leapfrog questions so it can share its knowledge with you. For most general questions both LLMs will generate the same or a very similar answer, whereas for questions that are around capabilities, each may only answer what is relevant to it.
Example prompts:
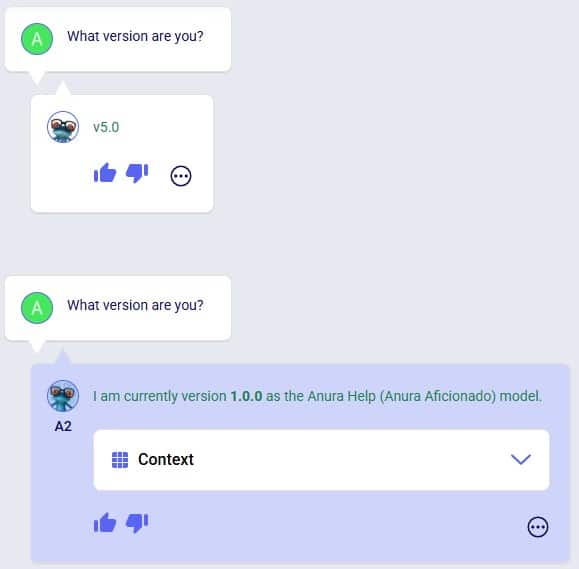
The following 5 screenshots show examples of these types of prompts & Leapfrog’s responses: 1) ask both LLMs about their version, 2) ask a general question about how to do something in Cosmic Frog (Text2SQL), 3) ask Anura Help for the Release Notes, and 4 & 5) ask both LLMs about what they are good at and what they are not good at:

Even though this documentation and Leapfrog example prompts are predominantly in English, Leapfrog supports many languages so users can ask questions in their most natural language. Where the Leapfrog response is in text form, it can respond in the language the question was asked in. Other response types like a standard message with a link or names of scenarios and scenario items will be in English.
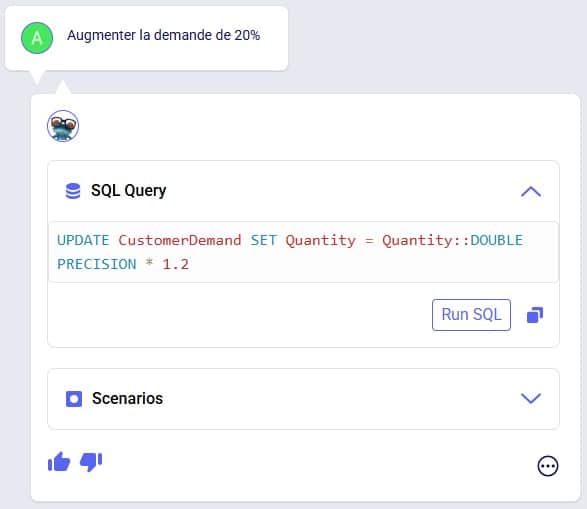
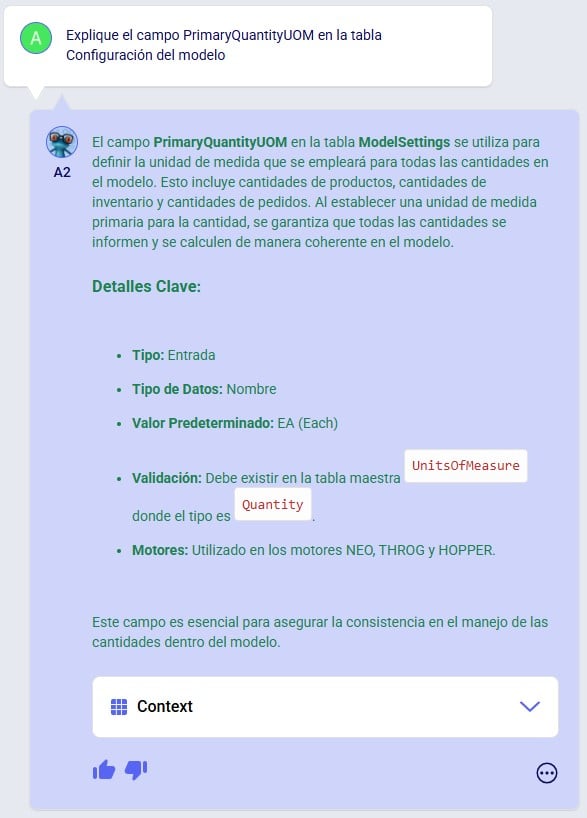
The following 3 screenshots show: 1) a list of languages Leapfrog supports, 2) a French prompt to increase demand by 20%, and 3) a Spanish prompt asking Leapfrog to explain the Primary Quantity UOM field on the Model Settings table:
To get the most out of Leapfrog, please take note of these tips & tricks:

After this is turned on, you can start using it by pressing the keyboard’s Windows key + H. A bar with a microphone which shows messages like “initializing”, “listening”, “thinking” will show up at the top of your active monitor:

Now you can speak into your computer’s microphone, and your spoken words will be turned into text. If you put your cursor in Leapfrog’s question / prompt area, click on the microphone in the bar at the top so your computer starts listening, and then say what you want to ask Leapfrog, it will appear in the prompt area. You can then click on the send icon to submit your prompt / question to Leapfrog.
The following screenshots show several examples of how one can build on previous prompts and responses and try to re-direct Leapfrog as described in bullets 6 and 7 of the Tips & Tricks above. In the first example user wants to delete records from an input table whereas Leapfrog’s initial response is to change the Status of these records to Exclude. The follow-up prompt clarifies that user wants to remove them. Note that it is not needed to repeat that it is about facilities based in the USA, which Leapfrog still knows from the previous prompt:
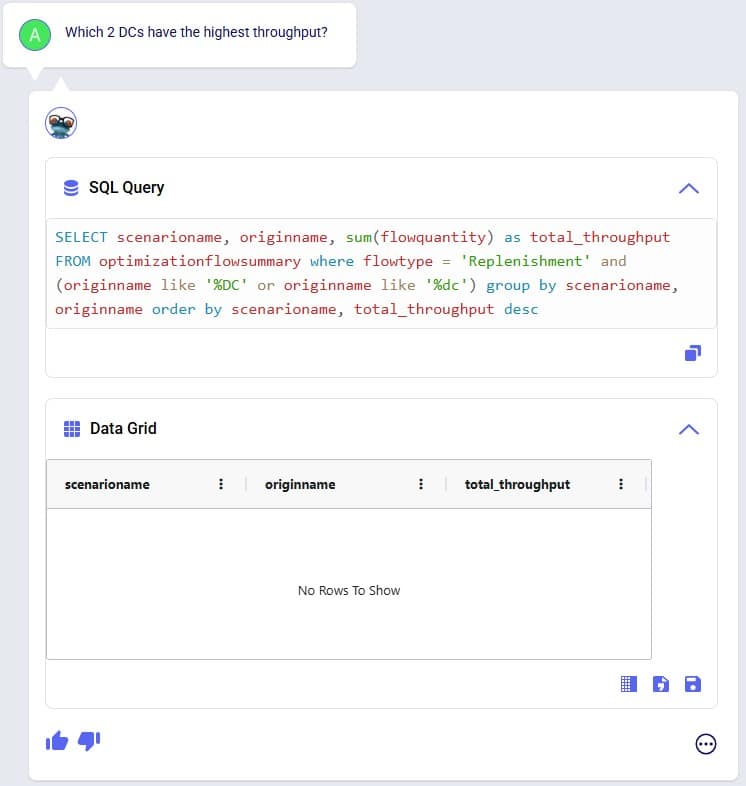
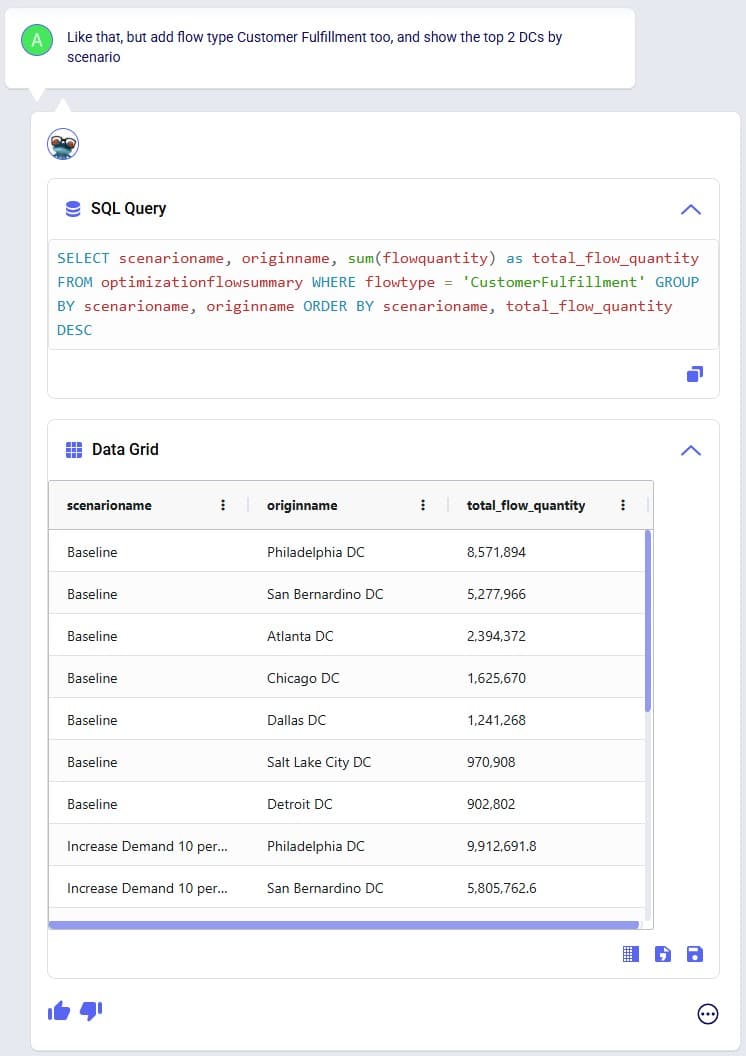
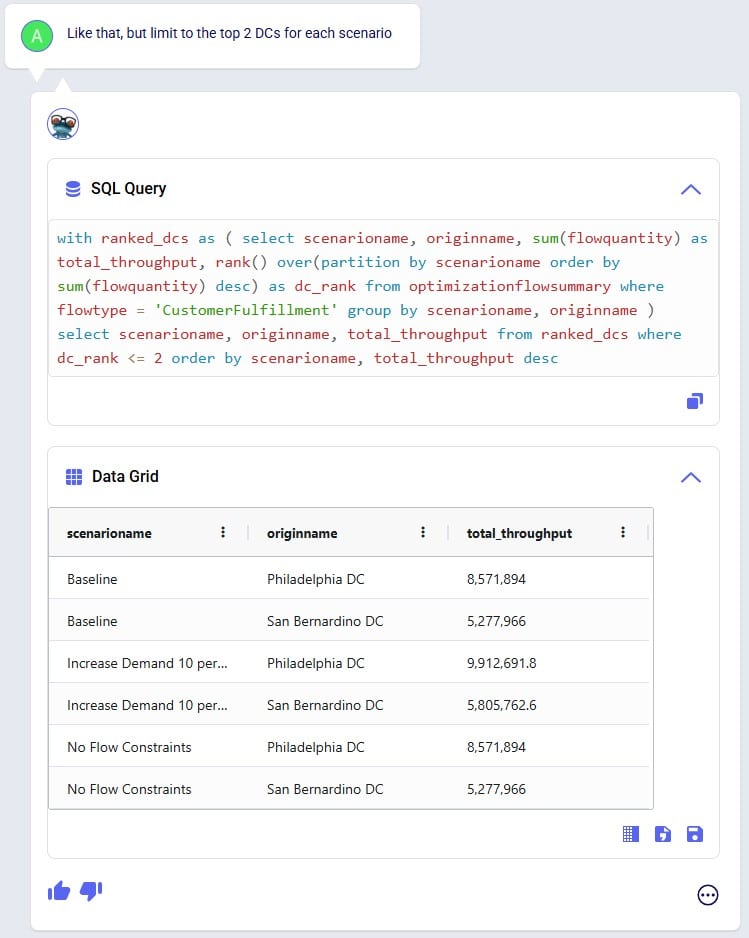
In the following example shown in the next 3 screenshots, user starts by asking Leapfrog to show the 2 DCs with the highest throughput. The SQL query response only looks at Replenishment flows, but user wants to include Customer Fulfillment flows too. Also, the SQL Query does not limit the list to the top 2 DCs. In the follow-up prompt the user clarifies this (“Like that, but…”) without needing to repeat the whole question. However, Leapfrog only picks up on the first request (adding the Customer Fulfillment flows), so in the third prompt user clarifies further (again: “Like that, but…”), and achieves what they set out to do:
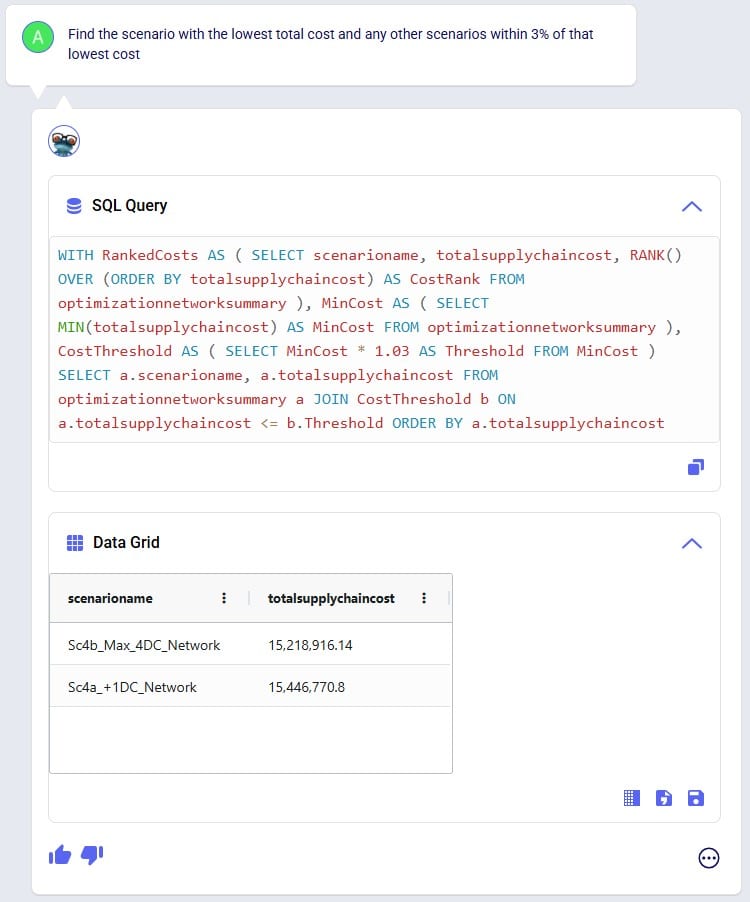
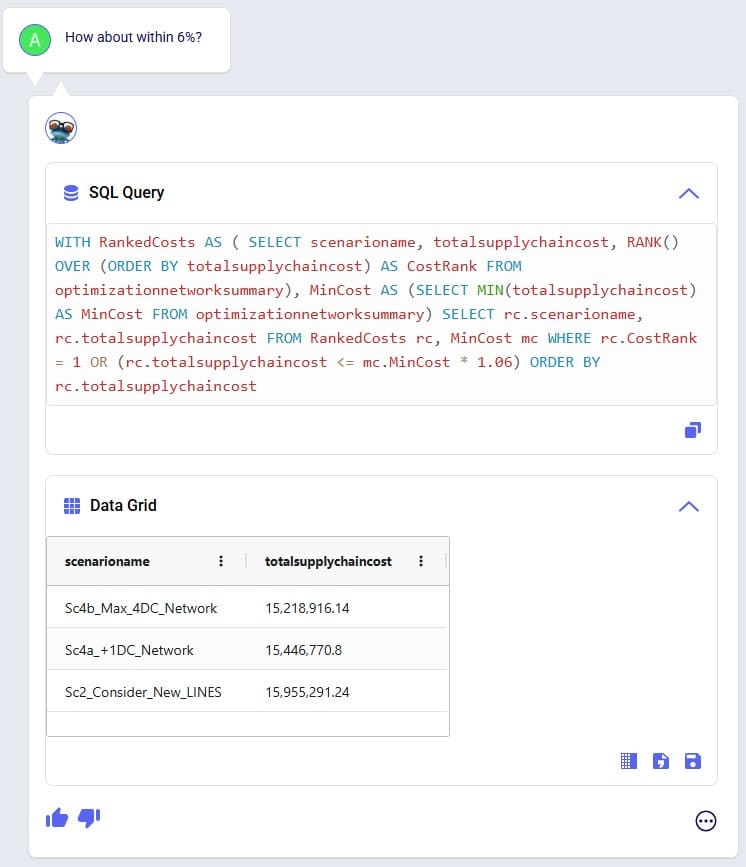
In the next 2 screenshots we see an example of first asking Leapfrog to show outputs that meet certain criteria (within 3%), and then essentially wanting to ask the same question but with the criteria changed (within 6%). There is no need to repeat the first prompt, it suffices to say something like “How about with [changed criteria]?”:
When Leapfrog only does part of what a user intends to do, it can often still be achieved in multiple steps. See the following screenshots where user intended to change 2 fields on the Production Count Constraints table and initially Leapfrog only changes one. The follow-up prompt simply consists of “And [change 2]”, building on the previous prompt. In the third prompt user was more explicit in describing the 2 changes and then Leapfrog’s response is what user intended to achieve:

Here we will step through the process of building a complete Cosmic Frog demo model, creating an additional scenario, running this new scenario and the Baseline scenario, and interrogating some of the scenarios’ outputs, all by using only Leapfrog.
Please note that if you are trying the same steps using Leapfrog in your Cosmic Frog:
We will first list the prompts that were used to build, run, and analyze the model, and then review the whole process step-by-step through (lots of!) screenshots. Here is the list of prompts that were submitted to Leapfrog (all of them used the Text2SQL LLM):
And here is the step-by-step process shown through screenshots, starting with the first prompt given to Leapfrog to create a new empty Cosmic Frog model with the name “US Distribution”:
Clicking on the link in Leapfrog’s response will take user to the Leapfrog module in this newly created US Distribution model:
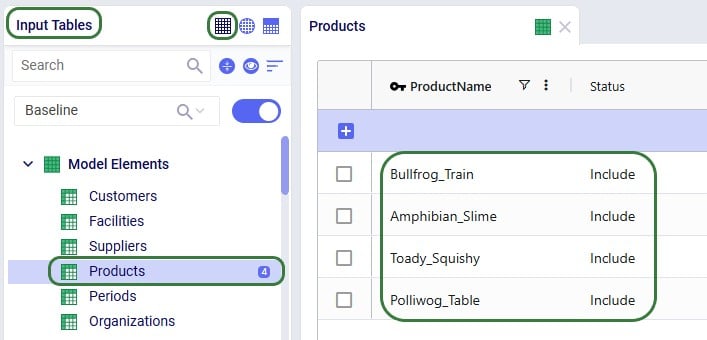
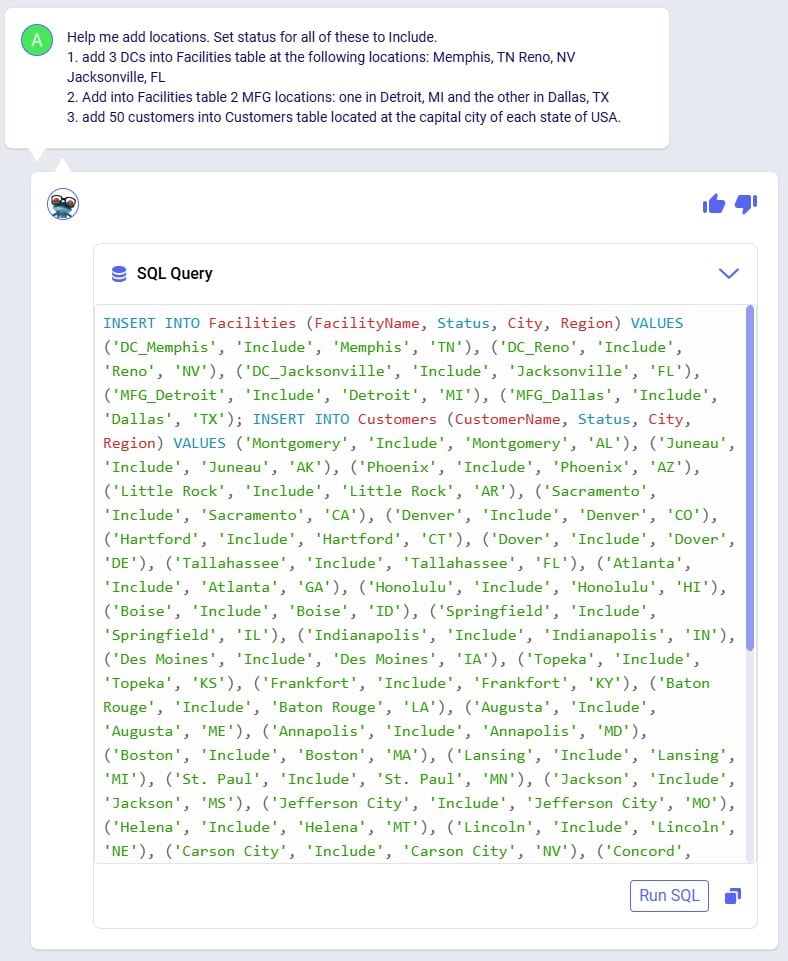
In the next prompt (the third one from the list), distribution center (DC) and manufacturing (MFG) locations are added to the Facilities table, and customer locations to the Customers table. Note the use of a numbered list to help Leapfrog break the response up into multiple INSERT INTO statements:
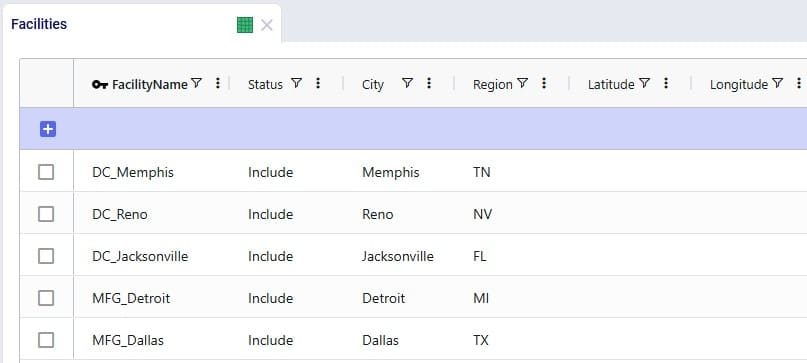
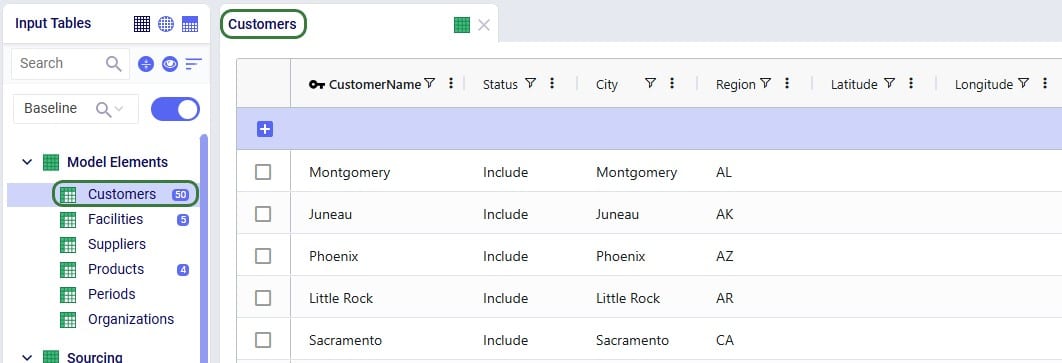
After running the SQL of that Leapfrog response, user has a look in the Facilities and Customers tables and notices that as expected all Latitude and Longitude values are blank:
Since all Facilities and Customers have blank Latitudes and Longitudes, our next (fourth) prompt is to geocode all sites:
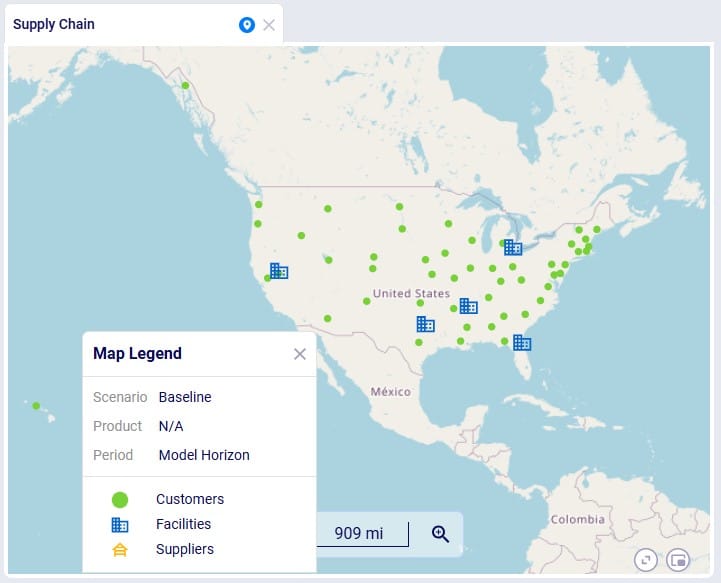
Once the geocoding completes (which can be checked in the Model Activity list), user clicks on one of the links in the Leapfrog response. This opens the Supply Chain map of the model in a new tab in the browser, showing Facilities and Customers, which all look to be geocoded correctly:
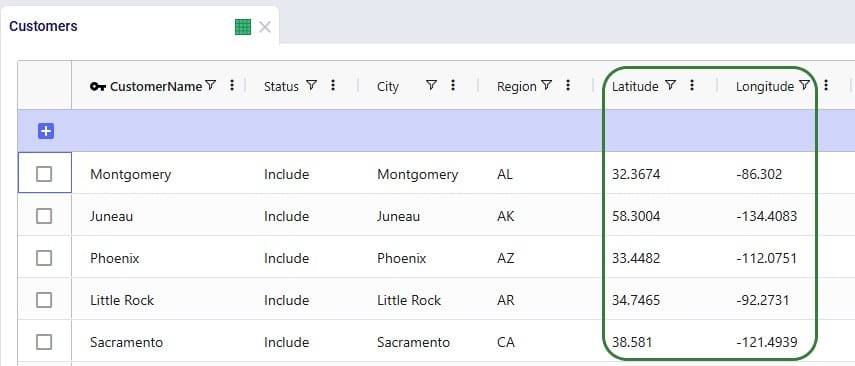
We can also double-check this in the Customers and Facilities tables, see for example next screenshot of a subset of 5 customers which now have values in their Latitude and Longitude fields:
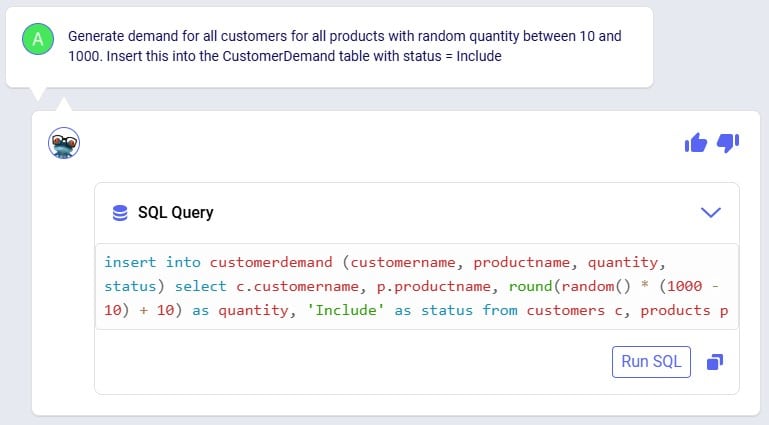
For a (network optimization - Neo) model to work, we will also need to add demand. As this is an example/demo model, we can use Leapfrog to generate random demand quantities for us, see this next (fifth) prompt and response:
After clicking the Run SQL button, we can have a look in the Customer Demand input table, where we find the expected 200 records (50 customers which each have demand for 4 products) and eyeballing the values in the Quantity field we see the numbers are as expected between 10 and 1000:
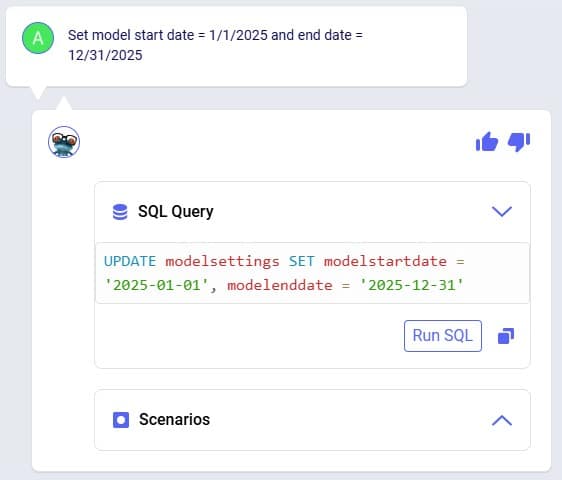
Our sixth prompt sets the model end and start dates, so the model horizon is all of 2025:
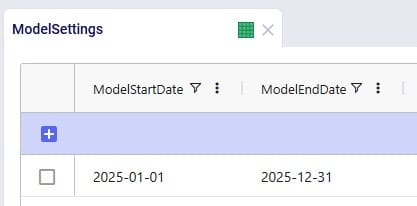
Again, we can double-check this after running the SQL response by having a look in the Model Settings input table:
We also need Transportation Policies, the following prompt (the seventh from our list) takes care of this and creates lanes from all MFGs to all DCs and from all DCs to all customers:

We see the 6 enumerated MFG (2 locations) to DC (3 locations) lanes when opening and sorting the Transportation policies table, plus the first few records of the 150 enumerated DC to customer lanes. No Unit Costs are set so far (blank values):
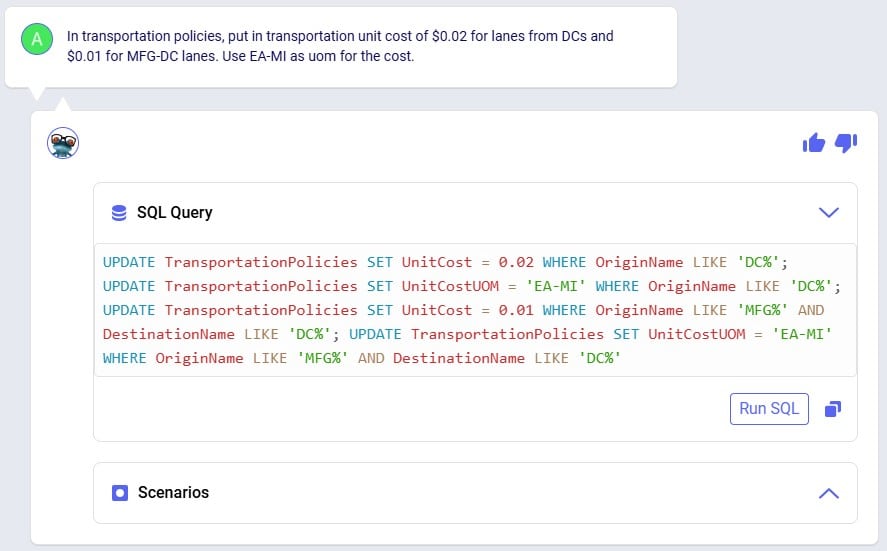
Our eighth prompt sets the transportation unit costs on the transportation policies created in the previous step. All use a unit of measure of EA-MI which means the costs entered are per unit per mile, and the cost itself is 1 cent on MFG to DC lanes and 2 cents on DC to customer lanes:
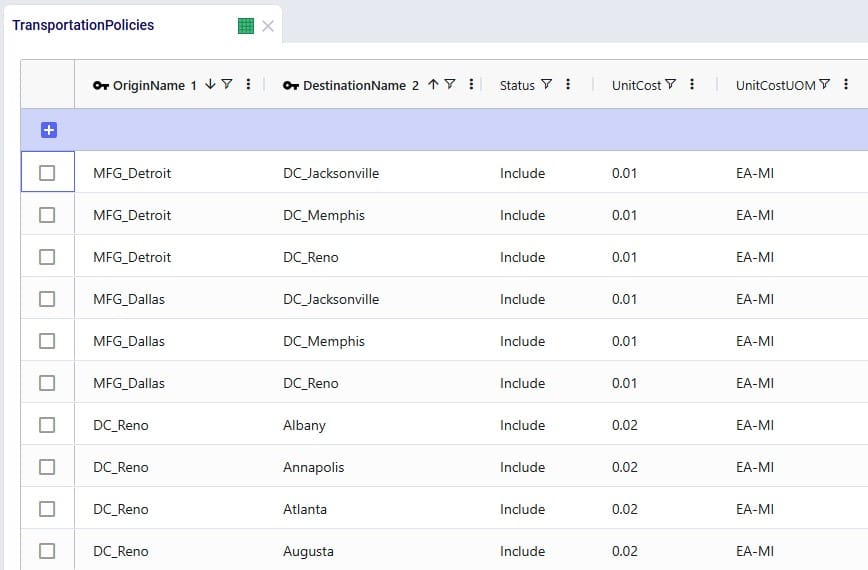
Clicking the Run SQL button will run the 4 UPDATE statements, and we can see the changes in the Transportation Policies input table:
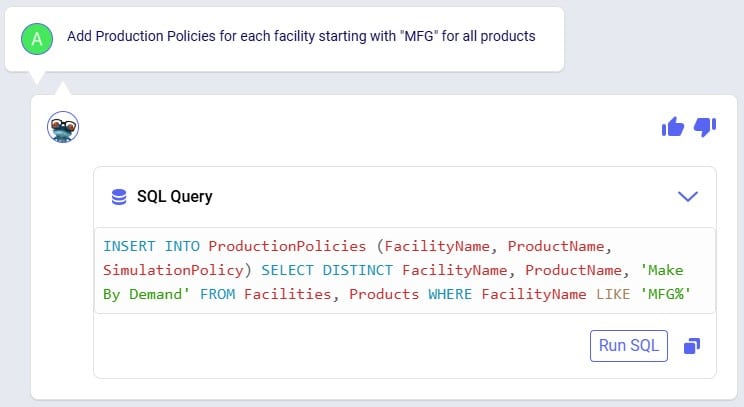
In order to run, the model also needs Production Policies, which the next (ninth) prompt takes care of: both MFG locations can produce all 4 products:
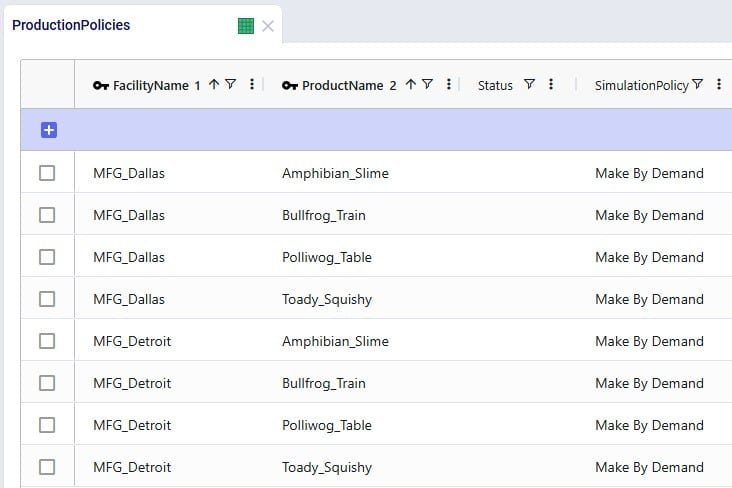
Again, double-checking after running the SQL from the response, we see the 8 expected records in the Production Policies input table:
Our 3 DCs have an upper limit as to how much throughput they can handle over the year, this is 50,000 for the DCs in Reno and Memphis and 100,000 for the DC in Jacksonville. Prompt number 10 sets these:
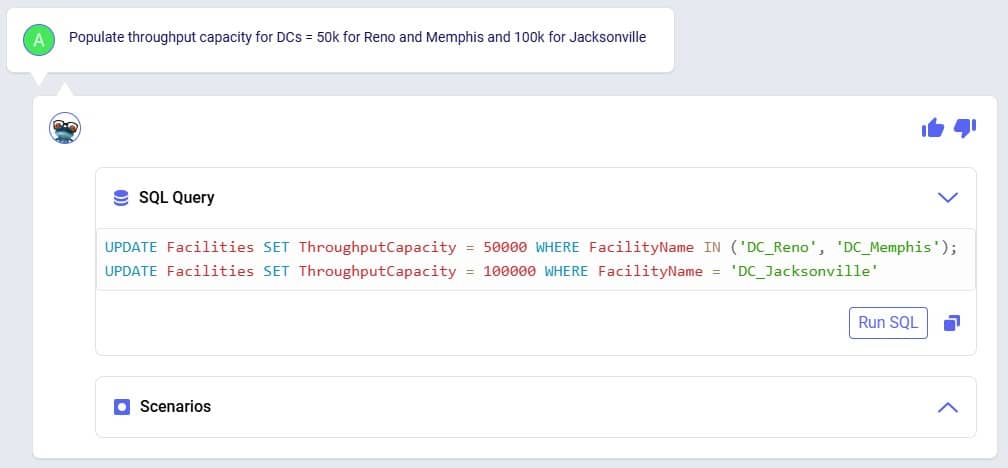
We can see these numbers appear in the Throughput Capacity field on the Facilities input table after running the SQL of Leapfrog’s response:

We want to explore what happens if the maximum throughput of the DC in Memphis is increased to 100,000; this is what the eleventh prompt asks to do:
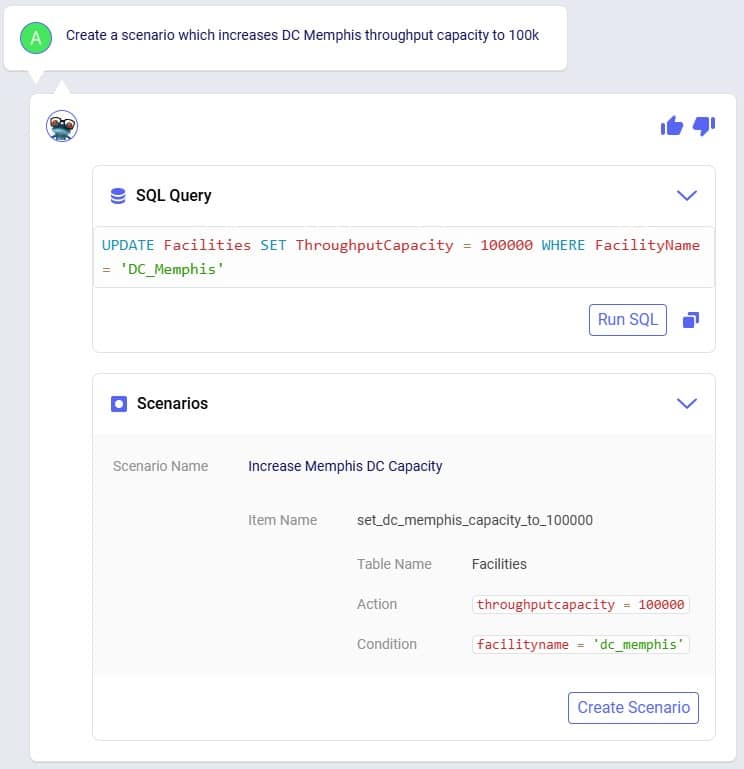
Leapfrog’s response has both a SQL UPDATE query, which would change the throughput at DC_Memphis in the Facilities input table, and a Scenarios section. We choose to click on the Create Scenario button so a new scenario is created (Increase Memphis DC Capacity) which will contain 1 scenario item (set_dc_memphis_capacity_to_100000) that sets the throughput capacity at DC_Memphis to 100,000:
Our small demo model is now complete, and we will use Leapfrog (using our twelfth prompt) to run network optimization (using the Neo engine) on the Baseline and Increase Memphis DC Capacity scenarios:
While the scenarios are running, we are thinking about what will be interesting outputs to review, and ask Leapfrog about how one can compare customers flows between scenarios (prompt number 13):
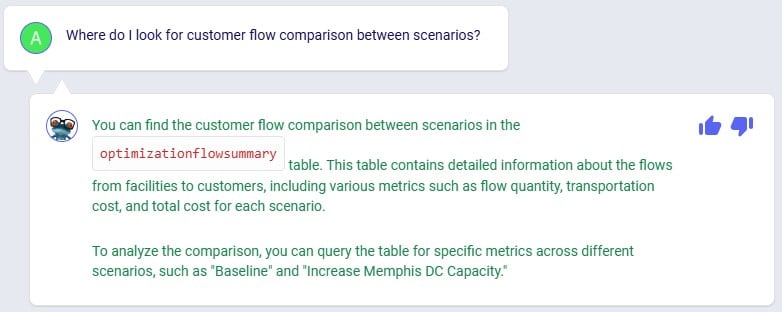
This information can come in handy in one of the next prompts to direct Leapfrog on where to look.
Using the link from the previous Leapfrog response where we started the optimization runs for both scenarios, we open the Run Manager in a new tab of the browser. Both scenarios have completed successfully as their State is set to Done:

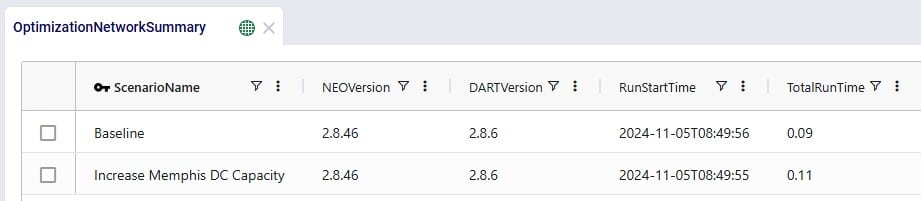
Looking in the Optimization Network Summary output table, we also see there are results for both scenarios:
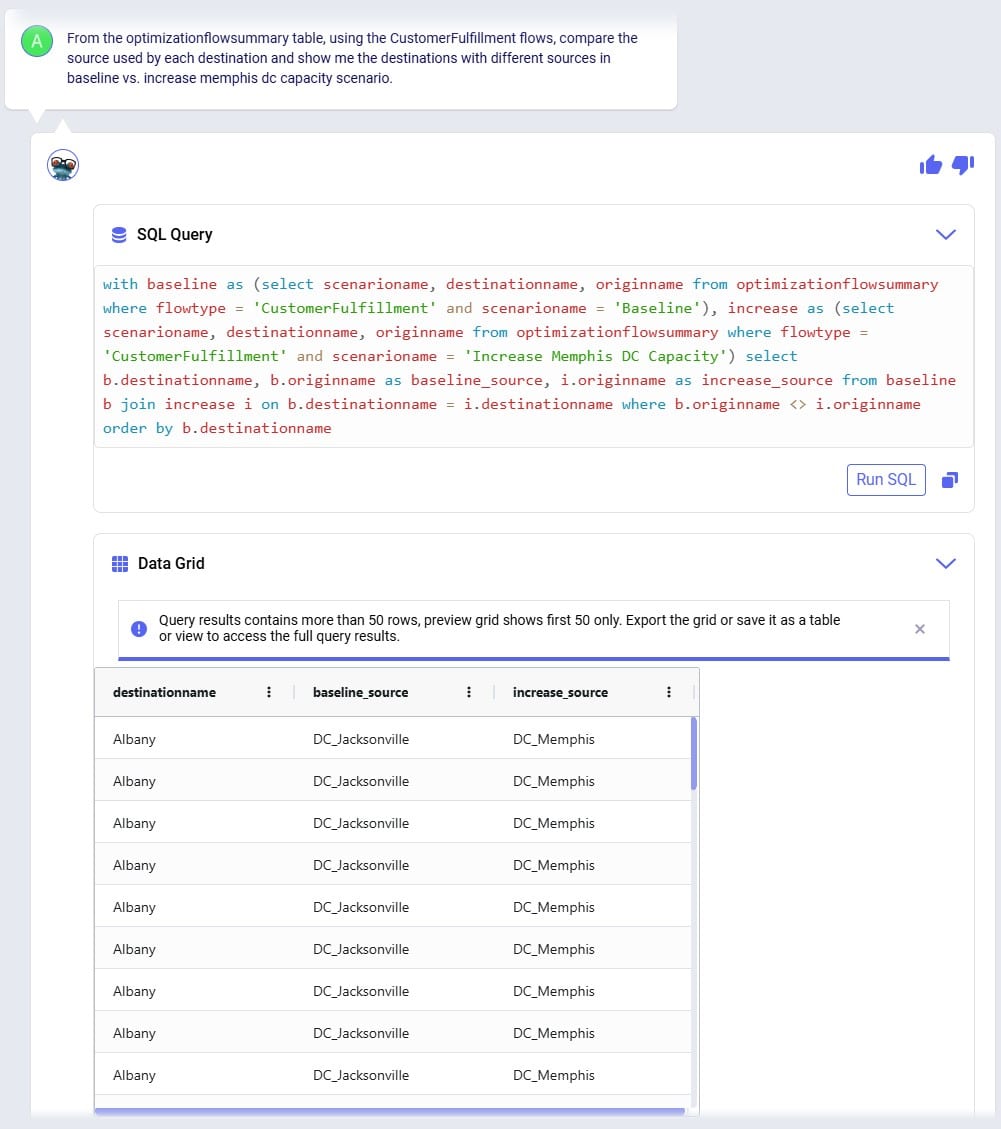
In the next few prompts Leapfrog is used to look at outputs of the 2 scenarios that have been run. The prompt (number 14 from our list) in the next screenshot aims to get Leapfrog to show us which customers have a different source in the Increase Memphis DC Capacity scenario as compared to the Baseline scenario:
Leapfrog’s response is almost what we want it to be, however it has duplicates in the Data Grid. Therefore, we follow our previous prompt up with the next one (number 15), where we ask to see only distinct combinations. Instead of “distinct” we could have also used the word “unique” in our prompt:
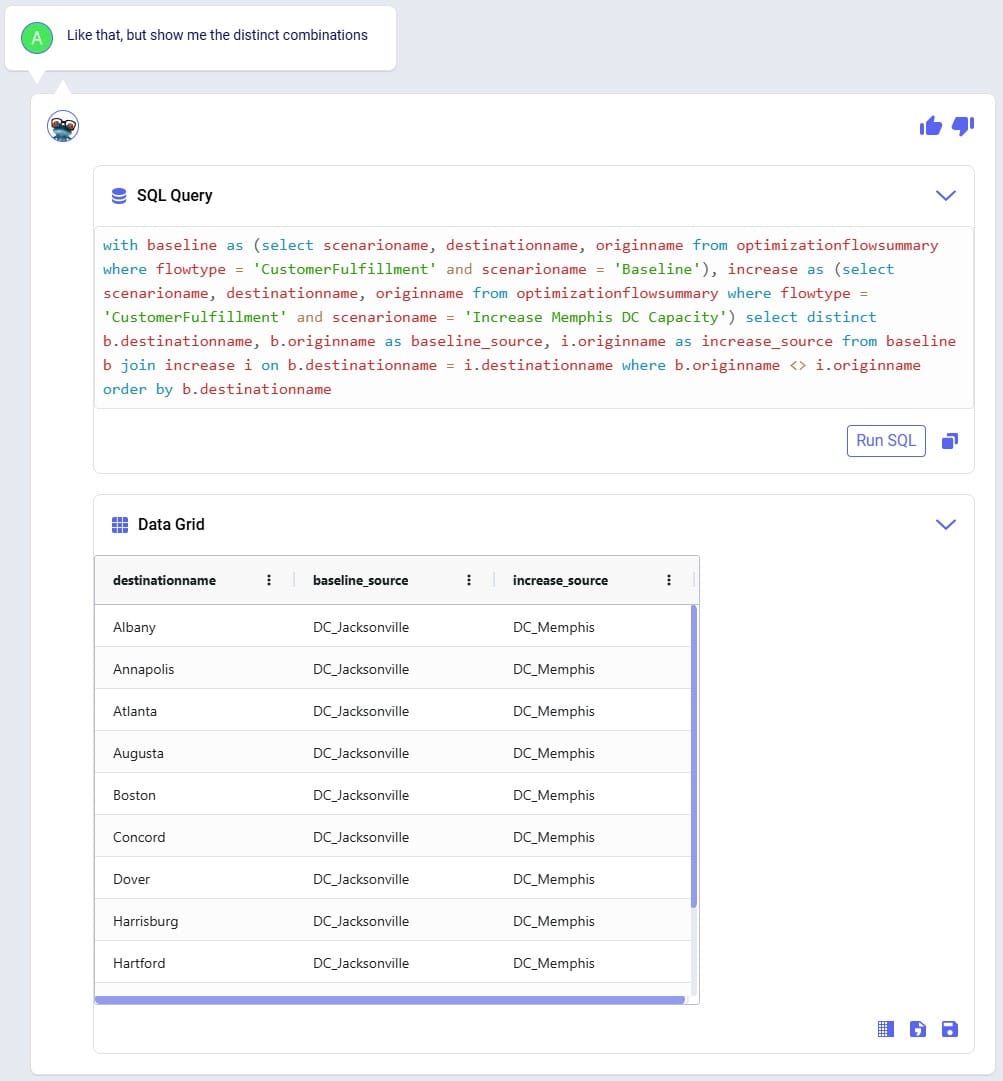
We see that the source for around 11-12 customers changed from the DC in Jacksonville in the Baseline to the DC in Memphis in the Increase Memphis DC Capacity scenario.
Cost comparisons between scenarios are usually interesting too, so that is what prompt number 16 asks about:
We notice that increasing the throughput capacity at DC_Memphis leads to a lower total supply chain cost by about 56.5k USD. Next, we want to see how much flow has shifted between the DCs in the Baseline scenario compared to the Increase Memphis DC Capacity scenario, which is what the last prompt (number 17) asks about:
This tells us that the throughput at DC_Reno is the same in both scenarios, but that increasing the DC_Memphis throughput capacity allows a shift of about 24k units from the DC in Jacksonville to the DC in Memphis (which was at its maximum 50k throughput in the Baseline scenario). This volume shift is what leads to the reduction in total supply chain cost.
We hope this gives you a good idea of what Leapfrog is capable of today. Stay tuned for more exciting features to be added in future releases!
Do you have any Leapfrog questions or feedback? Feel free to use the Frogger Pond Community to ask questions, share your experiences, and provide feedback. Or, shoot us an email at Leapfrog@Optilogic.com.
Happy Leapfrogging!
PERSONA: Alex is an experienced supply chain modeler who knows exactly what to analyze but often spends too much time pulling and formatting outputs. They are looking to be more efficient in summarizing results and identifying key drivers across scenarios. While confident in their domain expertise, they want help extracting insights faster without losing control or accuracy. They see AI as a time-saving partner that helps them focus on decision-making, not data wrangling.
USE CASE: After running multiple scenarios in Cosmic Frog, Alex wants to quickly understand the key differences in cost and service across designs. Instead of manually exporting data or writing SQL queries, Alex uses Leapfrog to ask natural-language questions which saves Alex hours and lets them focus on insight generation and strategic decision-making.
Model to use: Global Supply Chain Strategy (available under Get Started Here in the Explorer).
Prompt #1
Prompt #2
Prompt #3
Prompt #4
Prompt #5
PERSONA: Chris is an experienced supply chain modeler with a well-established, repeatable workflow that pulls data from internal systems to rebuild models every quarter. He relies on consistency in the model schema to keep his automation running smoothly.
USE CASE: With an upcoming schema change in Cosmic Frog, Chris is concerned about disruptions or errors in his process and wants Leapfrog to help provide info on the changes that may require him to update his workflow.
Model to use: any.
Prompt #1
Prompt #2
Prompt #3
PERSONA: Larry Loves LLMs – he wants to use an LLM to find answers.
USE CASE: I need to understand the outputs of this model someone else built. I want to know how many products come from each supplier for each network configuration. Can Leapfrog help with that?
Yes, Leapfrog can help with that! Let's use Anura Help to better understand which tables have that data and then ask Text2SQL to pull the data.
Model to use: any; Global Supply Chain Strategy (available under Get Started Here in the Explorer).
Prompt #1
Prompt #2
Leapfrog helps Cosmic Frog users explore and use their model data via natural language. View data, make changes, create & run scenarios, analyze outputs, learn all about the Anura schema that underlies Cosmic Frog models, and a whole lot more!
Leapfrog combines an extensive knowledge of PostgreSQL with the complete knowledge of Optilogic’s Anura data schema, and all the natural language capabilities of today’s advanced general purpose LLMs.
For a high-level overview and short video introducing Leapfrog, please see the Leapfrog landing page on Optilogic’s website.
In this documentation, we will first get users oriented on where to find Leapfrog and how to interact with it. In the section after, Leapfrog’s capabilities will be listed out with examples of each. Next, the Tips & Tricks section will give users helpful pointers so they can get the most out of Leapfrog. Finally, we will step through the process of building, running, and analyzing a Cosmic Frog model start to finish by only using Leapfrog!
Dive in if you’re ready to take the leap!
Start using Leapfrog by opening the module within Cosmic Frog:
Once the Leapfrog module is open, users’ screens will look similar to the following screenshot:
The example prompts when using the Anura Help LLM are shown here:
When first starting to use Leapfrog, users will also see the Privacy and Data Security statement, which reads as follows:
“Leapfrog AI Training: Optilogic does not use your model data to train Leapfrog. We do collect and store conversational data so it can be accessed again by the user, as well as to understand usage patterns and areas of strength/weakness for the LLM. Included in this data: natural language input prompts, text and SQL responses, as well as feedback from users. This information is maintained by Optilogic, not shared with third parties, and all of the conversation data is subject to the data security and privacy terms of the Optilogic platform.”
This message will stay visible within Leapfrog whenever it is being used, unless user clicks on the grey cross button on the right to close the message. Once closed, the message will not be shown again while using Leapfrog.
Conversation history is stored on the platform at the user level - not in the model database - so it does not get shared when a model is shared. Note that if you are working in a Team rather than in your My Account (see documentation on Teams on the Optilogic platform here), the Leapfrog conversations you are creating will be available to the other team members when they are working with the same model.
As mentioned in the previous section, Leapfrog currently makes use of 2 large language models (LLMs): Text2SQL and Anura Help (also referred to as Anura Aficionado or A2). They will be explained in some more detail here. There is also an appendix to this documentation where for a few example personas Leapfrog questions and responses are listed, which showcases how some users may predominantly use one model, while others may switch back and forth between them. Of course, when unsure, users can try a specific prompt using both LLMs to see which provides the most helpful response.
Please note that in future users will not need to indicate which LLM they want to run a prompt against as Leapfrog will recognize which one will be most suitable to use based on the prompt.
The Text2SQL LLM combines extensive knowledge of PostgreSQL with Optilogic’s Anura data schema, and all the natural language capabilities of today’s advanced general purpose LLMs. It has been further fine-tuned on a large set of prompt-response pairs hand-crafted by supply chain modeling experts. This allows the Text2SQL model to generate SQL queries from natural language prompts.
Prompts for which it is best to use the Text2SQL model often imply an action: “Show me X”, “Add Y”, “Delete Z”, “Run scenario A”, “Create B”, etc. See also the example prompts listed when starting a new conversation and those in the Prompt Library on the Frogger Pond community.
Leapfrog responses using this model are usually actionable: run the returned SQL query to add / edit / delete data, create a scenario or model, run a scenario, geocode locations, etc.
A full list of the capabilities of both LLMs is covered in the section “Leapfrog Capabilities” further below.
Anura Help (also referred to as Anura Aficionado or A2) is a specialized assistant that leverages advanced natural language processing to help users navigate and understand the Anura schema within Optilogic's Cosmic Frog application. The Anura schema is the foundational framework powering Cosmic Frog's optimization, simulation, and risk assessment capabilities. Anura Help eliminates traditional barriers to schema understanding by providing immediate, authoritative guidance for supply chain modelers, developers, and analysts.
Anura Help’s architecture uses the Retrieval Augmented Generation (RAG) approach: based on the natural language prompt, first the most relevant documents of those in its knowledge base are retrieved (e.g. schema details or engine awareness details). Next, it uses them to generate a natural language response.
Use the Anura Help model when wanting to learn about specific fields, tables or engines in Cosmic Frog. Its core capabilities include:
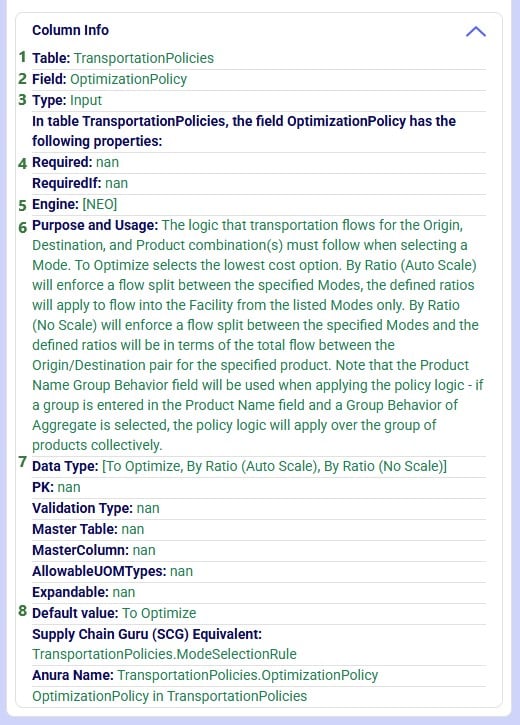
Responses from Leapfrog when using the Anura Help model are text-based and generated from retrieved documents shown in the context section. This context can for example be of the category “column info” where all details for a specific field are listed.
A full list of the capabilities of both LLMs is covered in the section “Leapfrog Capabilities” further below.
The following list compares the 2 LLMs available in Leapfrog today:
Depending on the type of question, Leapfrog’s response to it can take different forms: text, links, SQL queries, data grids, and options to create models, scenarios, scenario items, groups, run scenarios, or geocode locations. We will look at several examples of questions that result in these different types of responses in this section. This is not an exhaustive list; the next section “Leapfrog Capabilities” will go through the types of prompt-response pairs Leapfrog is capable of today.
For our first question, we used the first Text2SQL example prompt “What are the top 3 products by demand?” by clicking on it. After submitting the prompt, we see that Leapfrog is busy formulating a response:
And Leapfrog’s response to the prompt is as follows:
The metadata included here are:
Clicking on the icon with 3 dots again will collapse the response metadata.
This first prompt asked a question about the input data contained in the Cosmic Frog model. Let us now look at a slightly different type of prompt, which asks to change model input:
We are going to run the SQL query of the above response to our “Increase demand by 20%” prompt. Before doing so, let’s review a subset of 10 records of the Customer Demand input table (under the Data Module, in the Input Tables section):
Next, we will run the SQL query:
After clicking the Run SQL button at the bottom of the SQL Query section in Leapfrog’s response, it becomes greyed out so it will not accidentally be run again. Hovering over the button also shows text indicating the query was already run:
Note that closing and reopening the model or refreshing the browser will revert the Run SQL button’s state so it is clickable again.
Opening the Customer Demand table again and looking at the same 10 records, we see that the Quantity field has indeed been changed to its previous value multiplied by 1.2 (the first record’s value was 643, and 643 * 1.2 = 771.6, etc.):
Running the SQL query to increase the demand by 20% directly in the master data worked fine as we just saw. However, if we do not want to change the master data, but rather want to increase the demand quantity as part of a scenario, this is possible too:
After navigating to the Scenarios module within our Cosmic Frog model, we can see the scenario and its item have been created:
Note that if desired, the scenario and scenario item names auto-generated by Leapfrog can be changed in the Scenarios module of Cosmic Frog: just select the scenario or item and then choose “Rename” from the Scenario drop-down list at the top.
As a final example of a question & answer pair in this section, let us look at one where we use the Anura Help LLM, and Leapfrog responds with text plus context:
There is a lot of information listed here; we will explain the most commonly used information:
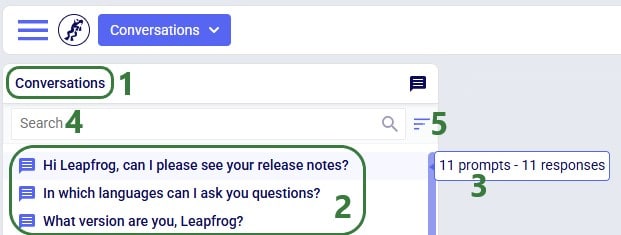
Prompts and their responses are organized into conversations in the Leapfrog module:
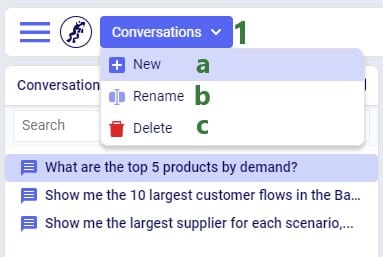
Users can organize their conversations with Leapfrog by using the options from the Conversations drop-down at the top of the Leapfrog module:
Users can rate Leapfrog responses by clicking on the thumbs up (like) and thumbs down (dislike) buttons and, optionally, providing additional feedback. This feedback is used to continuously improve Leapfrog. Giving a thumbs up to indicate the response is what you expected helps reinforce correct answers from Leapfrog. When a response is not what was expected or wrong, users can help improve Leapfrog’s underlying LLMs by giving the response a thumbs down. Especially thumbs down ratings & additional feedback will be reviewed so Leapfrog can learn and become more useful all the time.
When a response is not as expected as was the case in the following screenshot, user is encouraged to click the thumbs down button:
After clicking on the Send button, the detailed feedback is automatically added to the conversation:
The next screenshot shows an example where user gave Leapfrog’s response a thumbs up as it was what user expected. This feedback can then be used by Leapfrog to reinforce correct answers. User also had the option to provide detailed feedback again, using any of the following 4 optional tags: Showcase Example, Surprising, Fun, and Repeatable Use Case. In this example, user decided not to give detailed feedback and clicked on the Close button after the detailed feedback form came up:
If you have any additional Leapfrog feedback (or questions) beyond what can be captured here, you can feel free to send an email to Leapfrog@Optilogic.com. You are also very welcome to ask questions, share your experiences, and provide feedback on Leapfrog in the Frogger Pond Community.
We will now go back to our first prompt “What are the top 3 products by demand” to explore some of the options users have when Data Grids are included in a Leapfrog response, which is the case when Leapfrog’s SQL Query response is a SELECT statement.
When clicking on the Download File button, a zip file with the name of the active Cosmic Frog model appended with an ID, is downloaded to the user’s Downloads folder. The zip contains:
After clicking on Save, following message appears beneath the Data Grid in Leapfrog’s response:
Looking in the Custom Tables section (#2 in screenshot below) of the Data module (#1 in screenshot below), we indeed see this newly created table named top3products (#3 in screenshot below) with the same contents as the Data Grid of the Leapfrog response:
If we choose to save the Data Grid as a view instead of a table, it goes as follows:
We choose Save as View and give it the name of Top3Products_View. The message that comes up once the view is created reads as follows:
Going to the Analytics module in Cosmic Frog, choosing to add a new dashboard and in this new dashboard a new visualization, we can find the top3products_view in the Views section:
We will go back to the original Data Grid in Leapfrog’s response to explore a few more options user has here:
Please note:
In this section we will list out what Leapfrog is capable of and give examples of each capability. These capabilities include (the LLM each capability applies to is listed in parentheses):
Each of these capabilities will be discussed in the following sections, where a brief description of each capability is given, several example prompts illustrating the capability are listed, and a few screenshots showing the capability are included as well. Please remember that many more example prompts can be found in the Prompt Library on the Frogger Pond community.
Interrogate input and output data using natural language. Use it to check completeness of input data, and to summarize input and/or output data. Leapfrog responds with SELECT Statements and shows a Data Grid preview as we have seen above. Export the data grid or save it as a table or view for further use, which has been covered above already too.
Example prompts:
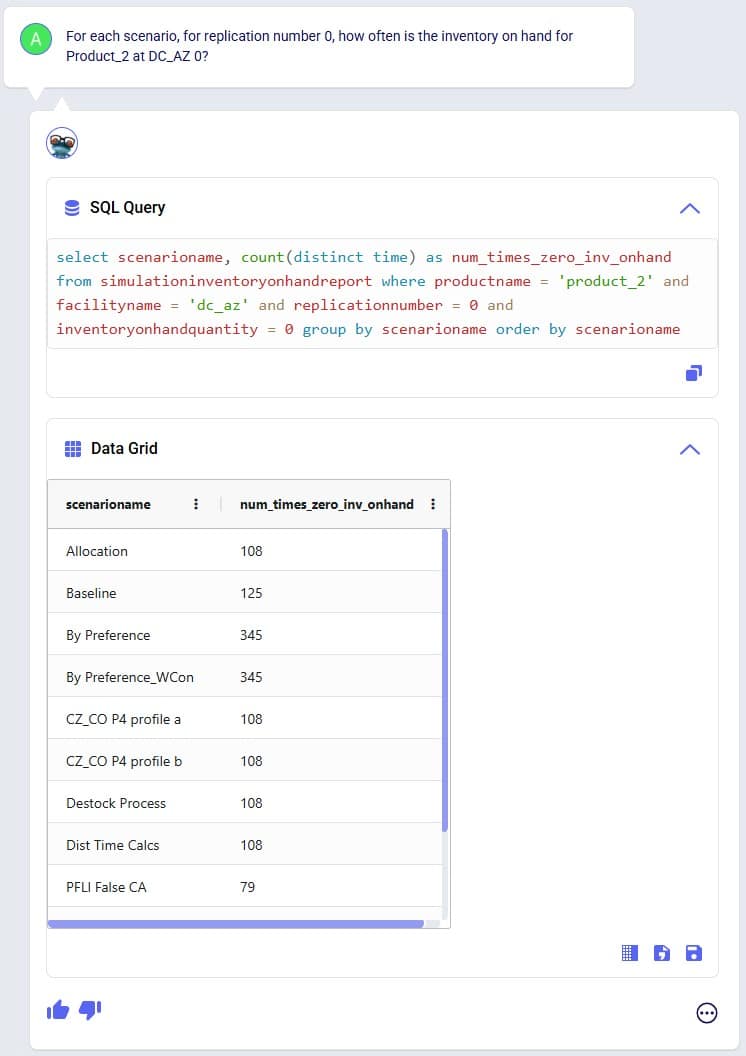
The following 3 screenshots show examples of checking input data (first screenshot), and interrogating output data (second and third screenshot):
Tell Leapfrog what you want to edit in the input data of your Cosmic Frog model, and it will respond with UPDATE, INSERT, and DELETE SQL Statements. User can opt to run these SQL Queries to permanently make the change in the master input data. For UPDATE SQL Queries, Leapfrog’s response will also include the option to create a scenario and scenario item that will make the change, which we will focus on in the next section.
Example prompts:
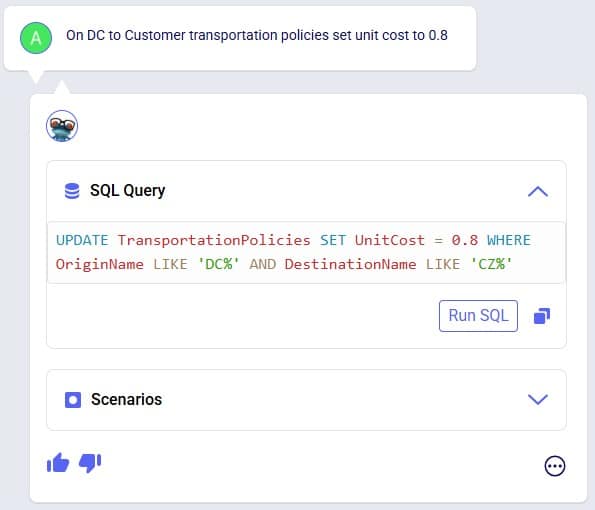
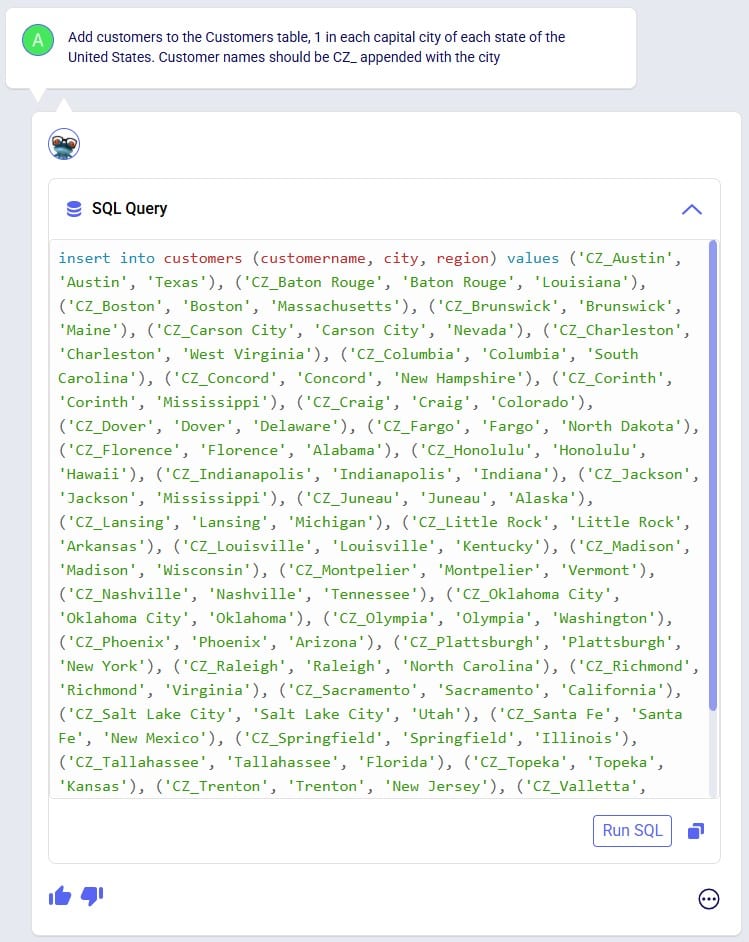
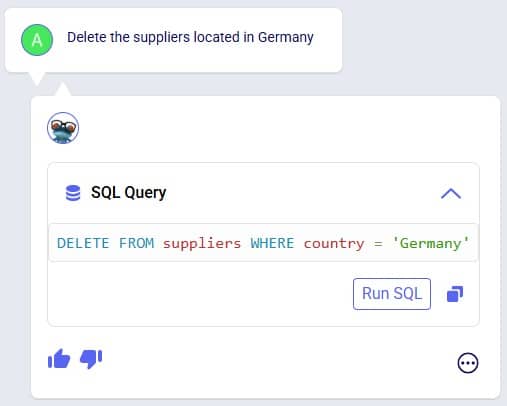
The following 3 screenshots show examples changing values in the input data (first screenshot), adding records to an input table (second screenshot), and deleting records from an input table (third screenshot):
Make changes to input data, but through scenarios rather than updating the master tables directly. Prompts that result in UPDATE SQL Queries will have a Scenarios part in their responses and users can easily create a new scenario that will make the input data change by one click of a button.
Example prompts:
The following 3 screenshots show example prompts with responses from which scenarios can be created: create a scenario which makes a change to all records in 1 input table (first screenshot), create a scenario which makes a change to records in 1 input table that match a condition (second screenshot), and create a scenario that makes changes in 2 input tables (third screenshot):
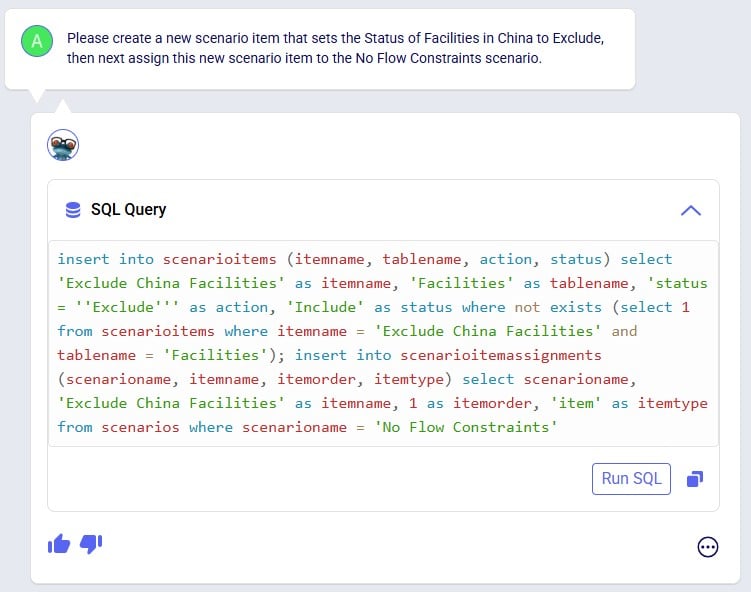
The above screenshots show examples of Leapfrog responses that contain a Scenarios section and from which new scenarios and scenario items can be created by clicking on the Create Scenario button. In addition to the above, users can also use Leapfrog to manage scenarios by using prompts that specifically create scenarios and/or items and assigning specific scenario items to specific scenarios. These result in INSERT INTO SQL Statements which can then be implemented by using the Run SQL button. See the following 2 screenshots for examples of this, where 1) a new scenario is created and an existing scenario item is then assigned to it, and 2) a new scenario item is created which is then assigned to an already existing scenario:
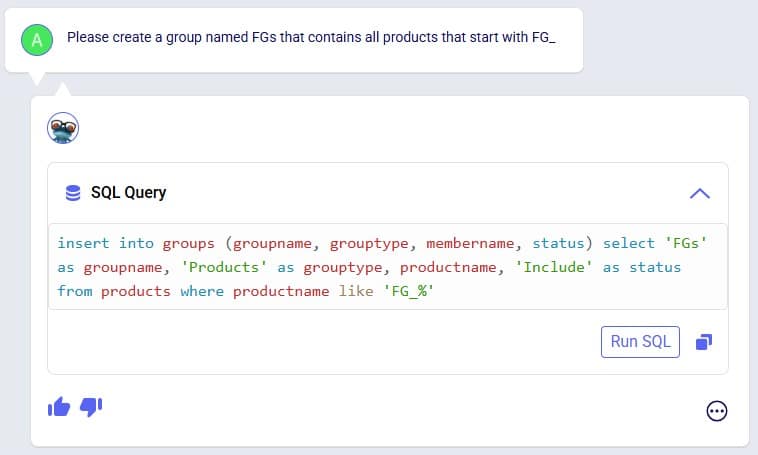
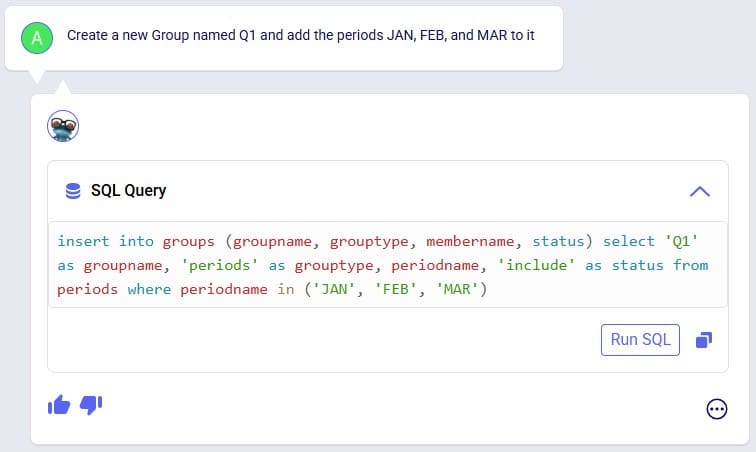
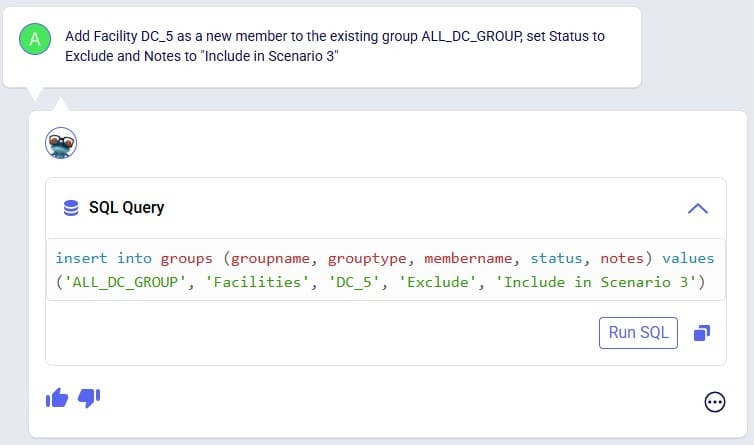
Leapfrog can create new groups and add group members to new and existing groups. Just specify the group name and which members it needs to have in the prompt and Leapfrog’s response will be one or multiple INSERT INTO SQL Statements.
Example prompts:
The following 4 screenshots show example prompts of creating groups and group members: 1) creates a new products group and adds products that have names with a certain prefix (FG_) to it, 2) creates a new periods group and adds 3 specific periods to it, 3) creates a new suppliers group and adds all suppliers that are located in China to it, and 4) adds a new member to an existing facilities group, and in addition explicitly sets the Status and Notes field of this new record in the Groups table:
Leapfrog can create a new, blank model. Leapfrog's response will ask user to confirm if they want to create the new model before creating it. If confirmed, the response will update to contain a link which takes user to the Leapfrog module in this newly created model in a new tab of the browser.
Example prompts:
Following 2 screenshots show an example where a new model named “FrogsLeaping” is created:
You can ask Leapfrog to kick off any model runs for you. Optionally you can specify the scenario(s) you want to be run, which engine to use, and what resource size to use. For Neo (network optimization) runs, user can additionally indicate if the infeasibility check should be turned on. If no scenario(s) are specified, all scenarios present in the model will be run. If no engine is specified, the Neo engine (network optimization) will be used. If no resource size is specified, S will be used. If for Neo runs it is not specified if the infeasibility check should be turned on or off it will be off by default.
Leapfrog’s response will summarize the scenario(s) that are to be run, the engine that will be used, the resource size that will be used, and for Neo runs if the infeasibility check will be on or off. If user indeed wants to run the scenario(s) with these settings, they can confirm by clicking on the Run button. If so, the response will change to contain a link to the Run Manager application on Optilogic’s platform, which will be opened in a new tab of the browser when clicked. In the Run Manager, users can monitor the progress of any model runs.
The engines available in Cosmic Frog are:
The resource sizes available are as follows, from smallest to largest: Mini, 4XS, 3XS, 2XS, XS, S, M, L, XL, 2XL, 3XL, 4XL, Overkill. Guidance on choosing a resource size can be found here.
Example prompts:
The following 2 screenshots show an example prompt where the response is to run the model: only the scenario name is specified in which case a network optimization (Neo) is run using resource size S with the infeasibility check turned off (False):
Leapfrog's response now indicates the run has been kicked off and provides a link (click on the word "here") to check the progress of the scenario run(s) in the Run Manager.
The next screenshot shows a prompt asking to specifically run Greenfield (Triad) on 2 scenarios, where the resource size to be used is specified in the prompt too:
The last screenshot in this section shows a prompt to run a specific scenario with the infeasibility check turned on:
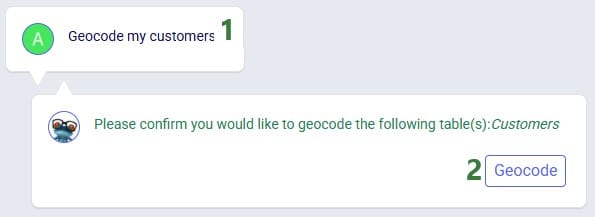
Leapfrog can find latitude & longitude pairs for locations (customers, facilities, and suppliers) based on the location information specified in these input tables (e.g. Address, City, Region, Country). Leapfrog’s response will ask user to confirm they want to geocode the specified table(s). If so, the response will change to contain a link which will open a Cosmic Frog map showing the locations that have been geocoded in a new tab of the browser.
Example prompts:
Notes on using Leapfrog for geocoding locations:
In the following screenshot, user asks Leapfrog to geocode customers:
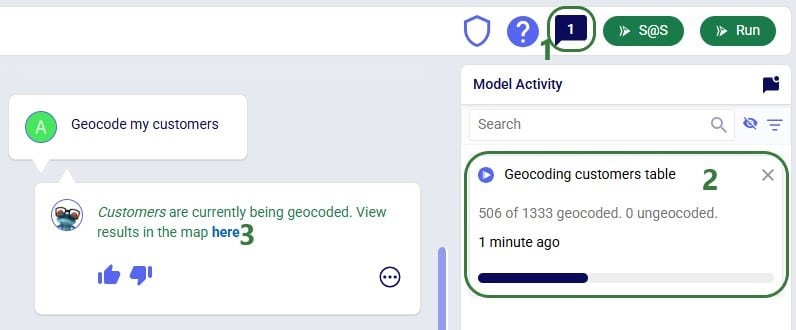
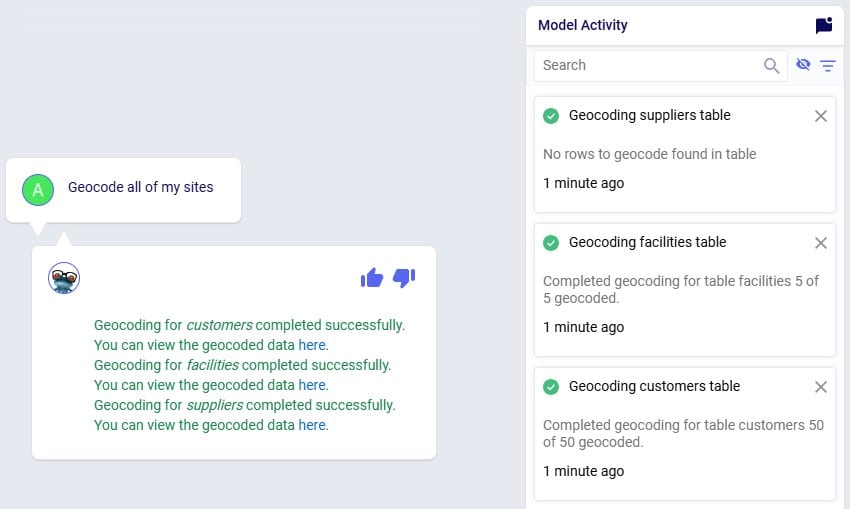
As geocoding a larger set of locations can take some time, it may look like the geocoding was not done or done incompletely if looking at the map or in the Customers / Facilities / Suppliers input tables shortly after kicking off the geocoding. A helpful tool which shows the progress of the geocoding (and other tools / utilities within Cosmic Frog) is the Model Activity list:
Leapfrog can teach users all about the Anura schema that underlies Cosmic Frog models, including:
Example prompts:
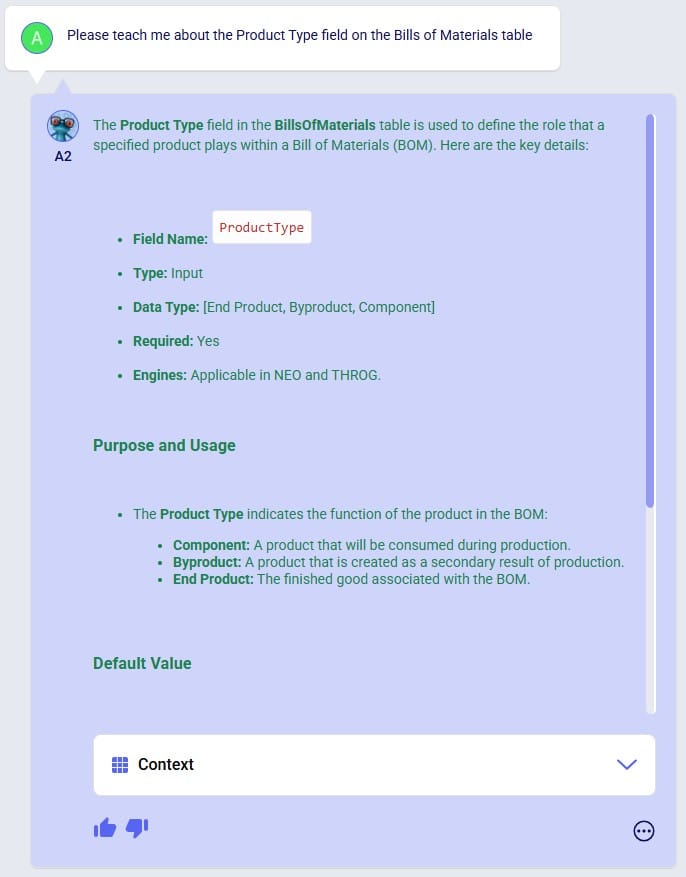
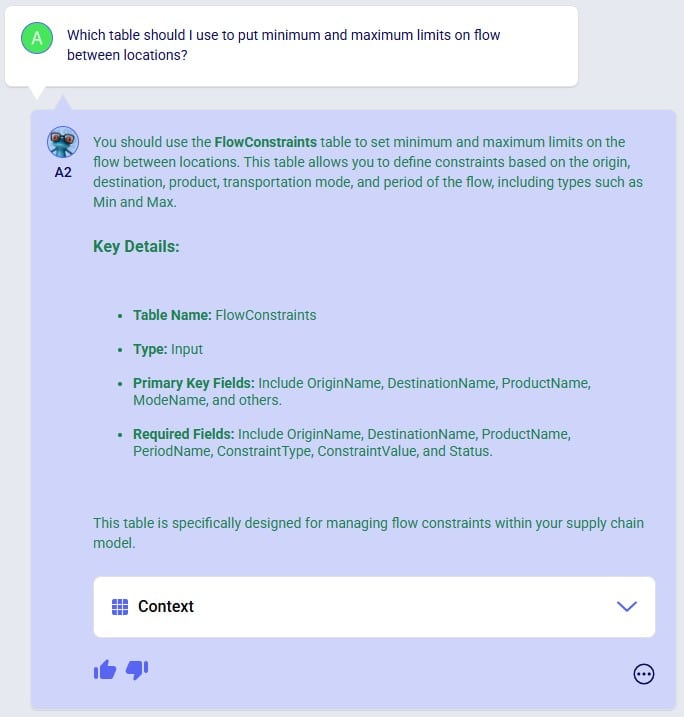
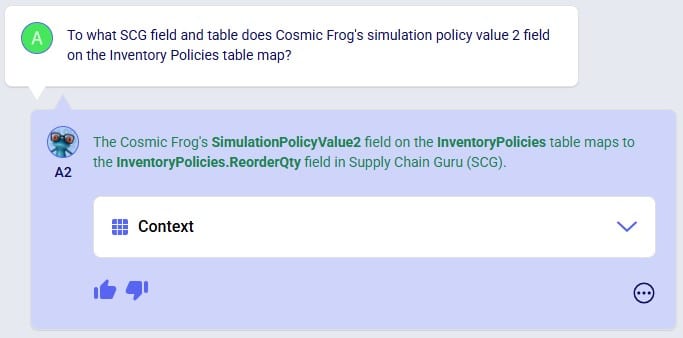
The following 4 screenshots show examples of these types of prompts & Leapfrog’s responses: 1) ask Leapfrog to teach us about a specific field on a specific table, 2) find out which table to use for a specific modelling construct, 3) understand the SCG to Cosmic Frog’s Anura mapping for a specific field on a specific table, and 4) ask about breaking changes in the latest Anura schema update:
Anura Help provides information around system integration, which includes:
Example prompts:
The following 4 screenshots show examples of these types of prompts & Leapfrog’s responses: 1) ask which tables are required to run a specific engine, 2) find out which engines use a specific table, 3) learn which table contains a certain type of outputs, and 4) ask about availability of template models for a specific purpose:
Leapfrog knows about itself, Optilogic, Cosmic Frog, the Anura database schema, LLM’s, and more. Ask Leapfrog questions so it can share its knowledge with you. For most general questions both LLMs will generate the same or a very similar answer, whereas for questions that are around capabilities, each may only answer what is relevant to it.
Example prompts:
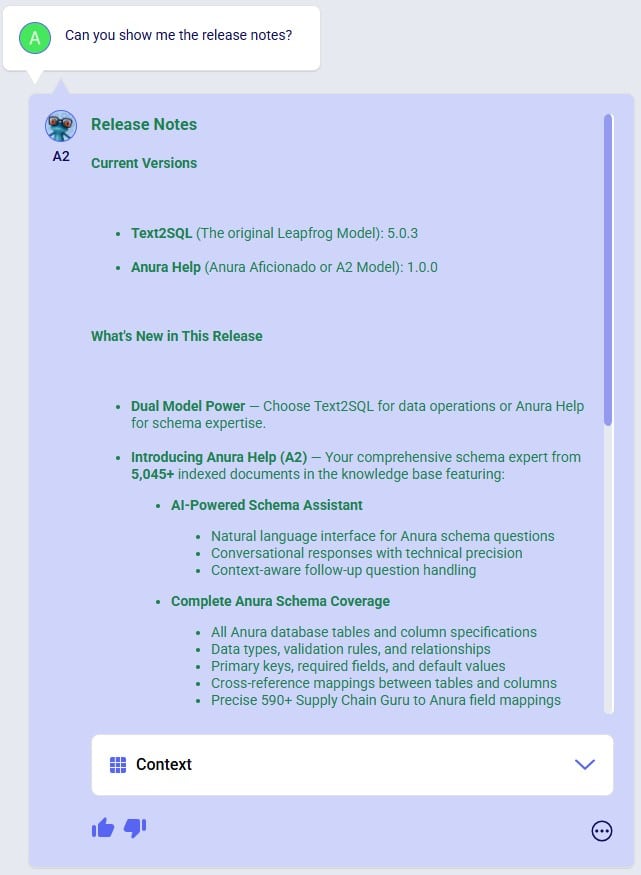
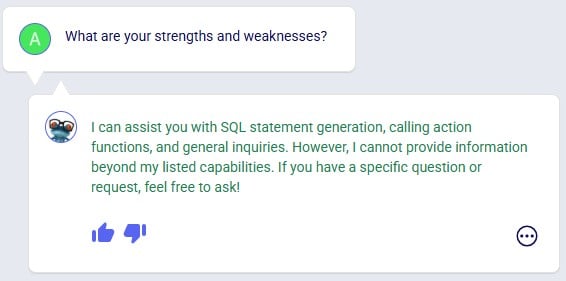
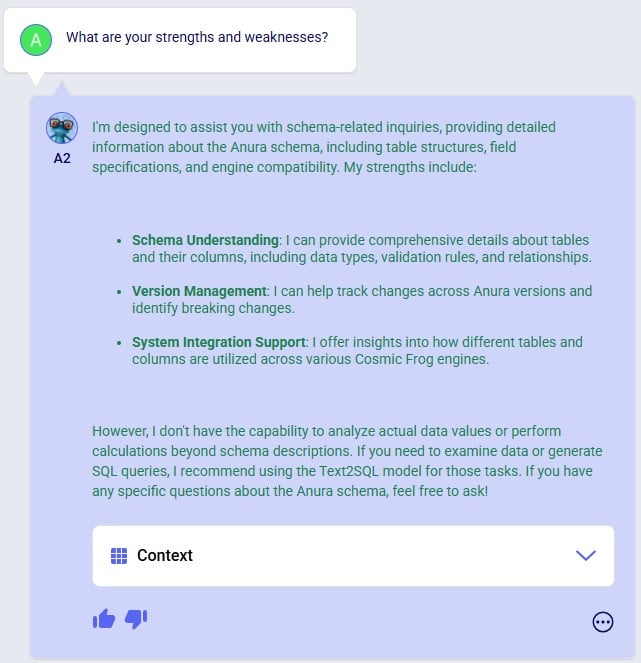
The following 5 screenshots show examples of these types of prompts & Leapfrog’s responses: 1) ask both LLMs about their version, 2) ask a general question about how to do something in Cosmic Frog (Text2SQL), 3) ask Anura Help for the Release Notes, and 4 & 5) ask both LLMs about what they are good at and what they are not good at:
Even though this documentation and Leapfrog example prompts are predominantly in English, Leapfrog supports many languages so users can ask questions in their most natural language. Where the Leapfrog response is in text form, it can respond in the language the question was asked in. Other response types like a standard message with a link or names of scenarios and scenario items will be in English.
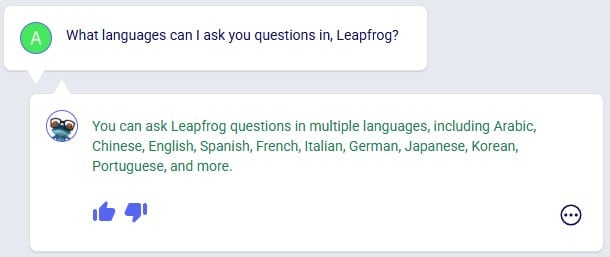
The following 3 screenshots show: 1) a list of languages Leapfrog supports, 2) a French prompt to increase demand by 20%, and 3) a Spanish prompt asking Leapfrog to explain the Primary Quantity UOM field on the Model Settings table:
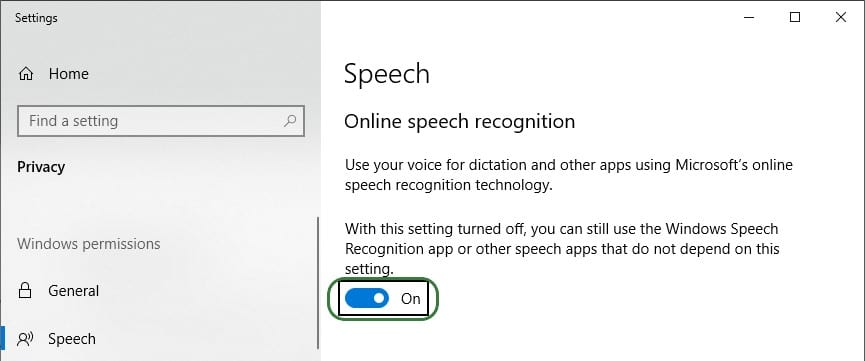
To get the most out of Leapfrog, please take note of these tips & tricks:
After this is turned on, you can start using it by pressing the keyboard’s Windows key + H. A bar with a microphone which shows messages like “initializing”, “listening”, “thinking” will show up at the top of your active monitor:
Now you can speak into your computer’s microphone, and your spoken words will be turned into text. If you put your cursor in Leapfrog’s question / prompt area, click on the microphone in the bar at the top so your computer starts listening, and then say what you want to ask Leapfrog, it will appear in the prompt area. You can then click on the send icon to submit your prompt / question to Leapfrog.
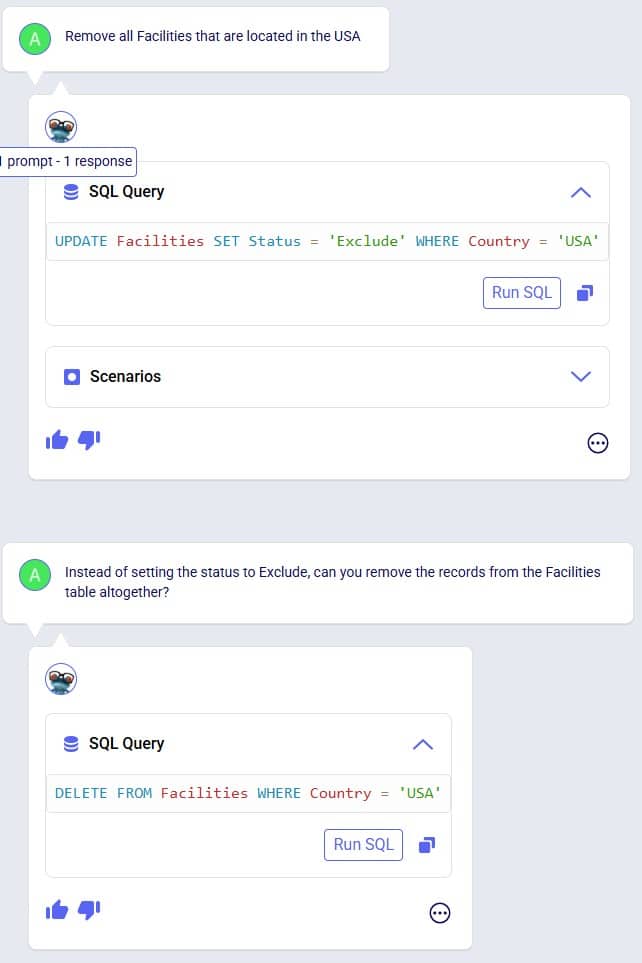
The following screenshots show several examples of how one can build on previous prompts and responses and try to re-direct Leapfrog as described in bullets 6 and 7 of the Tips & Tricks above. In the first example user wants to delete records from an input table whereas Leapfrog’s initial response is to change the Status of these records to Exclude. The follow-up prompt clarifies that user wants to remove them. Note that it is not needed to repeat that it is about facilities based in the USA, which Leapfrog still knows from the previous prompt:
In the following example shown in the next 3 screenshots, user starts by asking Leapfrog to show the 2 DCs with the highest throughput. The SQL query response only looks at Replenishment flows, but user wants to include Customer Fulfillment flows too. Also, the SQL Query does not limit the list to the top 2 DCs. In the follow-up prompt the user clarifies this (“Like that, but…”) without needing to repeat the whole question. However, Leapfrog only picks up on the first request (adding the Customer Fulfillment flows), so in the third prompt user clarifies further (again: “Like that, but…”), and achieves what they set out to do:
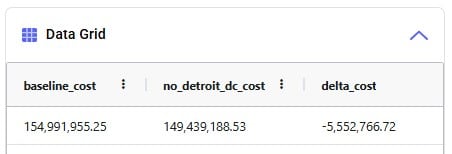
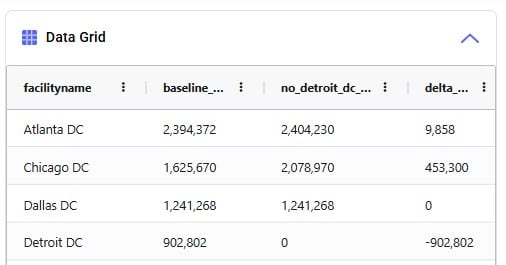
In the next 2 screenshots we see an example of first asking Leapfrog to show outputs that meet certain criteria (within 3%), and then essentially wanting to ask the same question but with the criteria changed (within 6%). There is no need to repeat the first prompt, it suffices to say something like “How about with [changed criteria]?”:
When Leapfrog only does part of what a user intends to do, it can often still be achieved in multiple steps. See the following screenshots where user intended to change 2 fields on the Production Count Constraints table and initially Leapfrog only changes one. The follow-up prompt simply consists of “And [change 2]”, building on the previous prompt. In the third prompt user was more explicit in describing the 2 changes and then Leapfrog’s response is what user intended to achieve:
Here we will step through the process of building a complete Cosmic Frog demo model, creating an additional scenario, running this new scenario and the Baseline scenario, and interrogating some of the scenarios’ outputs, all by using only Leapfrog.
Please note that if you are trying the same steps using Leapfrog in your Cosmic Frog:
We will first list the prompts that were used to build, run, and analyze the model, and then review the whole process step-by-step through (lots of!) screenshots. Here is the list of prompts that were submitted to Leapfrog (all of them used the Text2SQL LLM):
And here is the step-by-step process shown through screenshots, starting with the first prompt given to Leapfrog to create a new empty Cosmic Frog model with the name “US Distribution”:
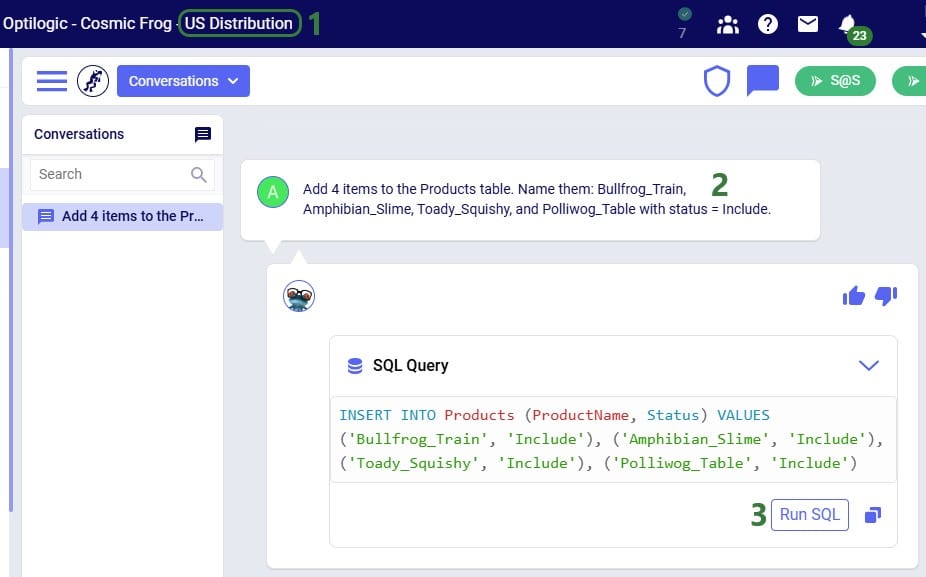
Clicking on the link in Leapfrog’s response will take user to the Leapfrog module in this newly created US Distribution model:
In the next prompt (the third one from the list), distribution center (DC) and manufacturing (MFG) locations are added to the Facilities table, and customer locations to the Customers table. Note the use of a numbered list to help Leapfrog break the response up into multiple INSERT INTO statements:
After running the SQL of that Leapfrog response, user has a look in the Facilities and Customers tables and notices that as expected all Latitude and Longitude values are blank:
Since all Facilities and Customers have blank Latitudes and Longitudes, our next (fourth) prompt is to geocode all sites:
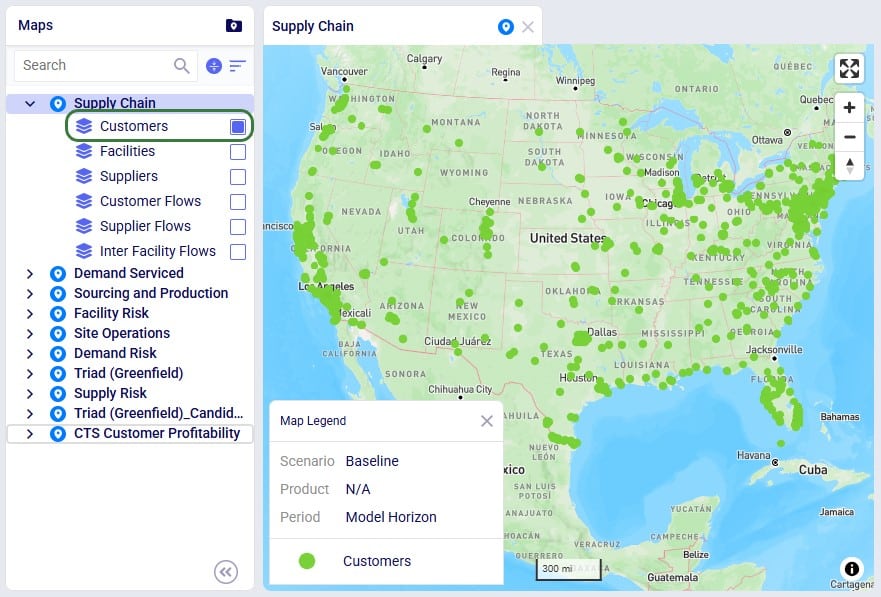
Once the geocoding completes (which can be checked in the Model Activity list), user clicks on one of the links in the Leapfrog response. This opens the Supply Chain map of the model in a new tab in the browser, showing Facilities and Customers, which all look to be geocoded correctly:
We can also double-check this in the Customers and Facilities tables, see for example next screenshot of a subset of 5 customers which now have values in their Latitude and Longitude fields:
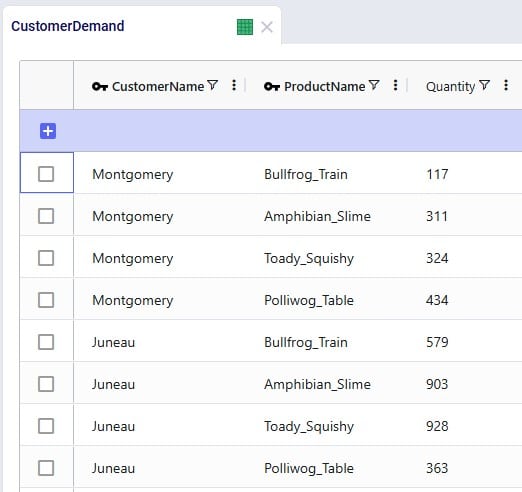
For a (network optimization - Neo) model to work, we will also need to add demand. As this is an example/demo model, we can use Leapfrog to generate random demand quantities for us, see this next (fifth) prompt and response:
After clicking the Run SQL button, we can have a look in the Customer Demand input table, where we find the expected 200 records (50 customers which each have demand for 4 products) and eyeballing the values in the Quantity field we see the numbers are as expected between 10 and 1000:
Our sixth prompt sets the model end and start dates, so the model horizon is all of 2025:
Again, we can double-check this after running the SQL response by having a look in the Model Settings input table:
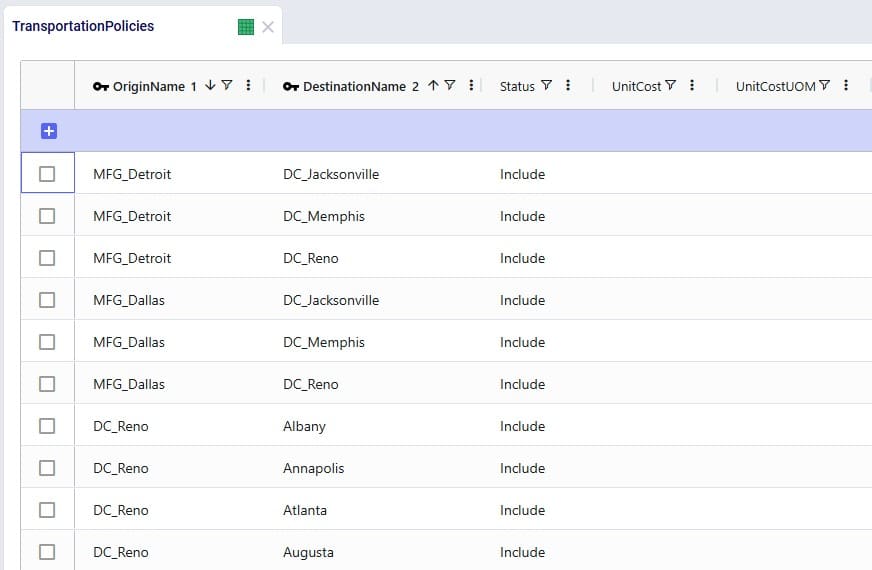
We also need Transportation Policies, the following prompt (the seventh from our list) takes care of this and creates lanes from all MFGs to all DCs and from all DCs to all customers:
We see the 6 enumerated MFG (2 locations) to DC (3 locations) lanes when opening and sorting the Transportation policies table, plus the first few records of the 150 enumerated DC to customer lanes. No Unit Costs are set so far (blank values):
Our eighth prompt sets the transportation unit costs on the transportation policies created in the previous step. All use a unit of measure of EA-MI which means the costs entered are per unit per mile, and the cost itself is 1 cent on MFG to DC lanes and 2 cents on DC to customer lanes:
Clicking the Run SQL button will run the 4 UPDATE statements, and we can see the changes in the Transportation Policies input table:
In order to run, the model also needs Production Policies, which the next (ninth) prompt takes care of: both MFG locations can produce all 4 products:
Again, double-checking after running the SQL from the response, we see the 8 expected records in the Production Policies input table:
Our 3 DCs have an upper limit as to how much throughput they can handle over the year, this is 50,000 for the DCs in Reno and Memphis and 100,000 for the DC in Jacksonville. Prompt number 10 sets these:
We can see these numbers appear in the Throughput Capacity field on the Facilities input table after running the SQL of Leapfrog’s response:
We want to explore what happens if the maximum throughput of the DC in Memphis is increased to 100,000; this is what the eleventh prompt asks to do:
Leapfrog’s response has both a SQL UPDATE query, which would change the throughput at DC_Memphis in the Facilities input table, and a Scenarios section. We choose to click on the Create Scenario button so a new scenario is created (Increase Memphis DC Capacity) which will contain 1 scenario item (set_dc_memphis_capacity_to_100000) that sets the throughput capacity at DC_Memphis to 100,000:
Our small demo model is now complete, and we will use Leapfrog (using our twelfth prompt) to run network optimization (using the Neo engine) on the Baseline and Increase Memphis DC Capacity scenarios:
While the scenarios are running, we are thinking about what will be interesting outputs to review, and ask Leapfrog about how one can compare customers flows between scenarios (prompt number 13):
This information can come in handy in one of the next prompts to direct Leapfrog on where to look.
Using the link from the previous Leapfrog response where we started the optimization runs for both scenarios, we open the Run Manager in a new tab of the browser. Both scenarios have completed successfully as their State is set to Done:
Looking in the Optimization Network Summary output table, we also see there are results for both scenarios:
In the next few prompts Leapfrog is used to look at outputs of the 2 scenarios that have been run. The prompt (number 14 from our list) in the next screenshot aims to get Leapfrog to show us which customers have a different source in the Increase Memphis DC Capacity scenario as compared to the Baseline scenario:
Leapfrog’s response is almost what we want it to be, however it has duplicates in the Data Grid. Therefore, we follow our previous prompt up with the next one (number 15), where we ask to see only distinct combinations. Instead of “distinct” we could have also used the word “unique” in our prompt:
We see that the source for around 11-12 customers changed from the DC in Jacksonville in the Baseline to the DC in Memphis in the Increase Memphis DC Capacity scenario.
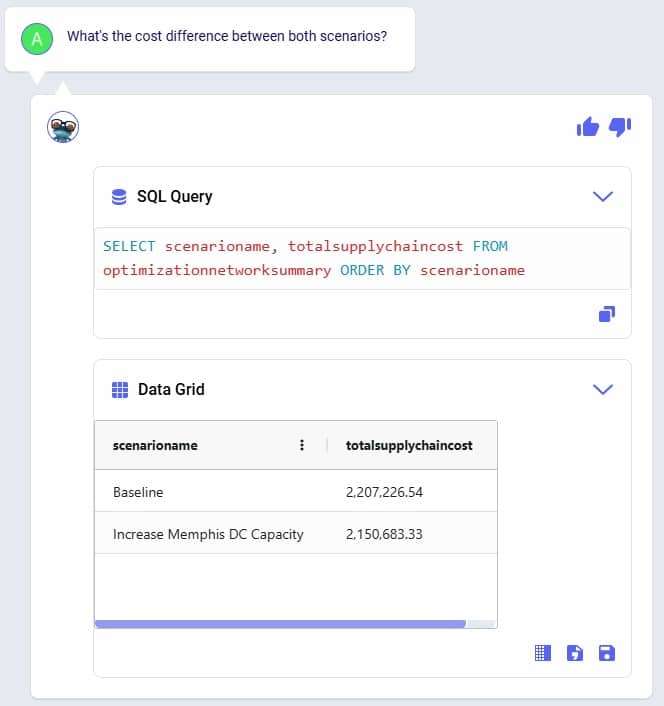
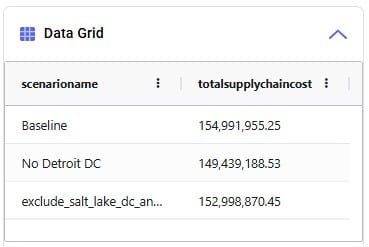
Cost comparisons between scenarios are usually interesting too, so that is what prompt number 16 asks about:
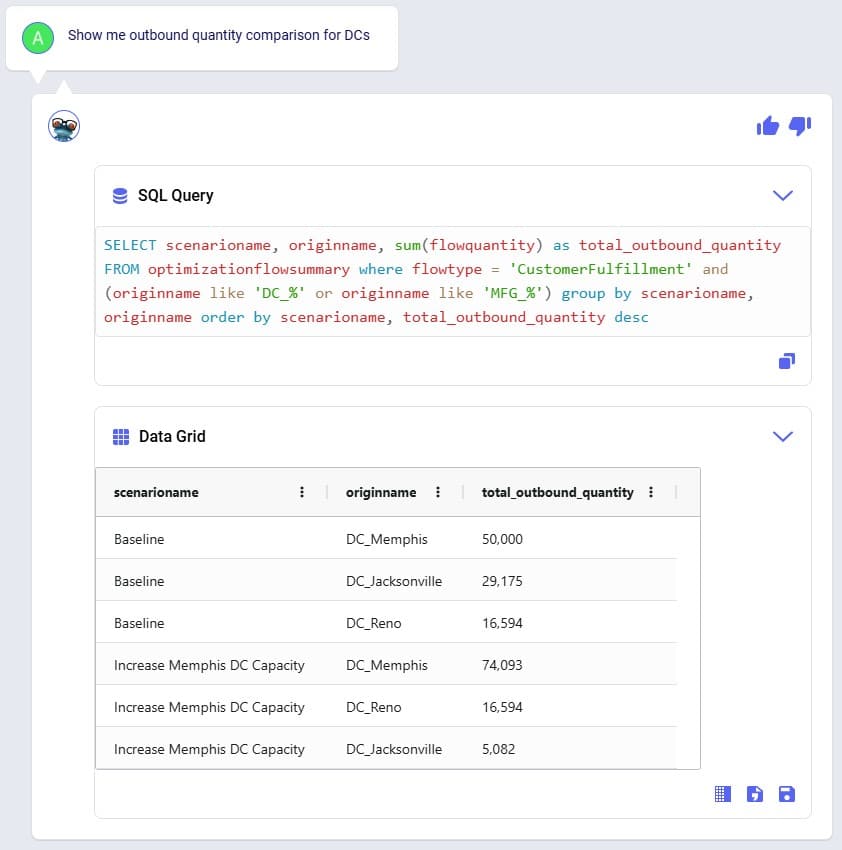
We notice that increasing the throughput capacity at DC_Memphis leads to a lower total supply chain cost by about 56.5k USD. Next, we want to see how much flow has shifted between the DCs in the Baseline scenario compared to the Increase Memphis DC Capacity scenario, which is what the last prompt (number 17) asks about:
This tells us that the throughput at DC_Reno is the same in both scenarios, but that increasing the DC_Memphis throughput capacity allows a shift of about 24k units from the DC in Jacksonville to the DC in Memphis (which was at its maximum 50k throughput in the Baseline scenario). This volume shift is what leads to the reduction in total supply chain cost.
We hope this gives you a good idea of what Leapfrog is capable of today. Stay tuned for more exciting features to be added in future releases!
Do you have any Leapfrog questions or feedback? Feel free to use the Frogger Pond Community to ask questions, share your experiences, and provide feedback. Or, shoot us an email at Leapfrog@Optilogic.com.
Happy Leapfrogging!
PERSONA: Alex is an experienced supply chain modeler who knows exactly what to analyze but often spends too much time pulling and formatting outputs. They are looking to be more efficient in summarizing results and identifying key drivers across scenarios. While confident in their domain expertise, they want help extracting insights faster without losing control or accuracy. They see AI as a time-saving partner that helps them focus on decision-making, not data wrangling.
USE CASE: After running multiple scenarios in Cosmic Frog, Alex wants to quickly understand the key differences in cost and service across designs. Instead of manually exporting data or writing SQL queries, Alex uses Leapfrog to ask natural-language questions which saves Alex hours and lets them focus on insight generation and strategic decision-making.
Model to use: Global Supply Chain Strategy (available under Get Started Here in the Explorer).
Prompt #1
Prompt #2
Prompt #3
Prompt #4
Prompt #5
PERSONA: Chris is an experienced supply chain modeler with a well-established, repeatable workflow that pulls data from internal systems to rebuild models every quarter. He relies on consistency in the model schema to keep his automation running smoothly.
USE CASE: With an upcoming schema change in Cosmic Frog, Chris is concerned about disruptions or errors in his process and wants Leapfrog to help provide info on the changes that may require him to update his workflow.
Model to use: any.
Prompt #1
Prompt #2
Prompt #3
PERSONA: Larry Loves LLMs – he wants to use an LLM to find answers.
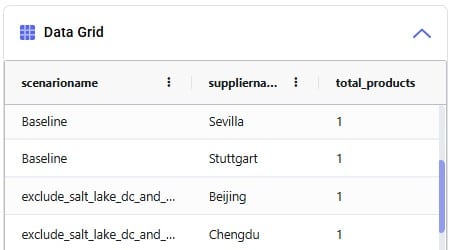
USE CASE: I need to understand the outputs of this model someone else built. I want to know how many products come from each supplier for each network configuration. Can Leapfrog help with that?
Yes, Leapfrog can help with that! Let's use Anura Help to better understand which tables have that data and then ask Text2SQL to pull the data.
Model to use: any; Global Supply Chain Strategy (available under Get Started Here in the Explorer).
Prompt #1
Prompt #2


