Sensitivity at Scale Scenarios in Cosmic Frog
One of Cosmic Frog’s great competitive features is the ability to quickly run many sensitivity analysis scenarios in parallel on Optilogic’s Cloud-based platform. This built-in Sensitivity at Scale (S@S) functionality lets a user run sensitivity on demand quantity and transportation costs with 1 click of a button, on any scenario using any of Cosmic Frog’s engines. In this documentation, we will walk through how to kick-off a S@S run, where to track the status of the scenarios, and show some example outputs of S@S scenarios once they have completed running.
Starting S@S Scenarios
Kicking off a S@S analysis is simply done by clicking on the green S@S button on the right-hand side in the toolbar at the top of Cosmic Frog:
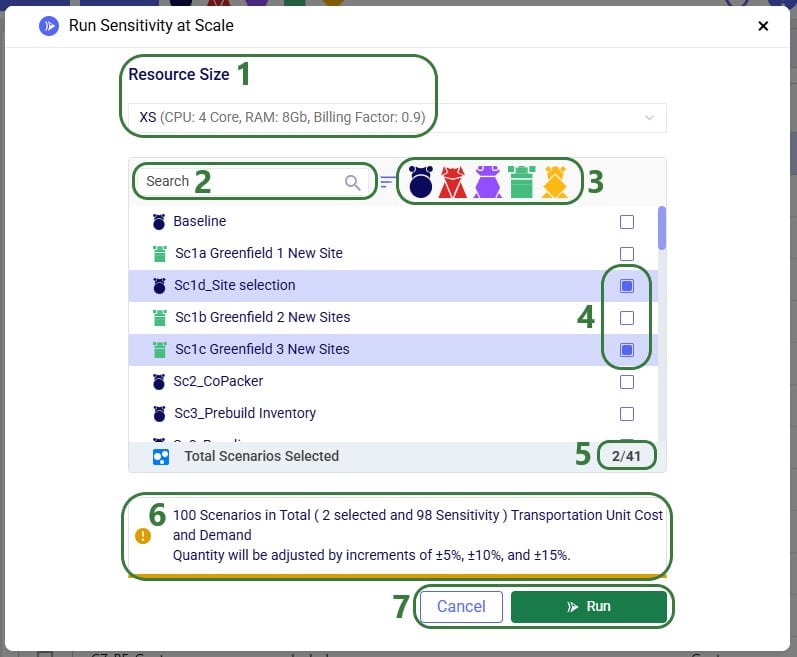
After clicking on the S@S button, the Run Sensitivity at Scale screen comes up:
- User can select the Resource Size that they deem most appropriate for the scenarios to be run on. Larger resource sizes have more CPUs and more RAM available; however, they also have higher billing factors. Therefore, the aim is usually to choose a resource size as small as possible to limit the number of hours used for running the scenarios, while still being large enough for the scenarios to not run out of memory. A good strategy is to first run 1 scenario (the scenario that the sensitivity is to be performed on for example), review its CPU and Memory usage in the Run Manager, and then decide which resource size is best to use for the sensitivity scenarios. More guidance on Resource Size selection and assessment can be found in this help article “Resource Size Selection (Neo)”.
- To facilitate finding the scenario(s) to run, users can type into the Search box to filter the scenario list for scenarios that contain the entered text.
- Clicking on this icon with the horizontal bars allows the user to sort the scenario list. Two sort options are available:
- Default: the Baseline scenario, which is running the model with all the input tables as is, will be listed first, then followed by the scenarios in the order they were added to the model.
- A-Z Name: this sorts the scenario list in alphabetical order. Clicking on this sort option again sorts the list in reverse alphabetical order.
- The scenario(s) to run S@S on can be selected by checking their checkboxes in the scenario list. Here 2 scenarios have been selected: Sc1d_Site selection, a network optimization (Neo) scenario, and Sc1c Greenfield 3 New Sites, a Greenfield (Triad) scenario.
- At the bottom of the scenario list, it is summarized how many scenarios have been selected.
- Underneath the scenario selection list, a note tells the user how many scenarios will be run, and which model values will be changed. In this case 100 scenarios in total will be run:
- The 2 selected in the list, Sc1d_Site selection and Sc1c Greenfield 3 New Sites.
- Sensitivity on each of the 2 selected scenarios where Transportation Unit Cost is varied from -15% to +15% in 5% increments and Demand Quantity is also varied in this same manner. So, 7 values for each are used (-15%, -10%, -5%, 0%, 5%, 10%, and 15%), which leads to 7 * 7 = 49 sensitivity scenarios for each selected scenario.
- When ready to start running the sensitivity at scale scenarios, user can click on the Run button. Should user decide to not run the S@S scenarios at this time, they can close the Run Sensitivity at Scale screen without kicking off any runs by clicking on the Cancel button.
Please note that the parameters that are configured on the Run Settings screen (which comes up when clicking on the Run button at the right top of Cosmic Frog) are used for the Sensitivity at Scale scenario runs.
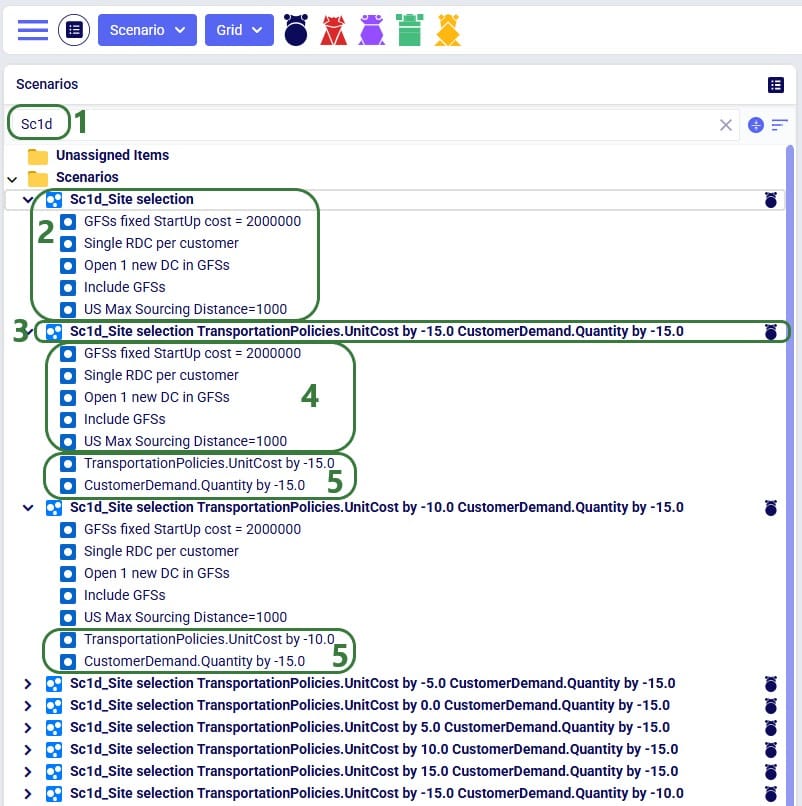
The scenarios are then created in the model, and we can review their setup by switching to the Scenarios module within Cosmic Frog:
- In the search box “Sc1d” was typed in to find all scenarios that contain this text.
- This is scenario Sc1d_Site Selection, which was 1 of the 2 original scenarios selected to run S@S scenarios for. We see that it has 5 scenario items assigned to it and that it is a network optimization (Neo) scenario.
- Then we see 49 more scenarios in the list (not all shown in the screenshot), which all start with Sc1d_Site selection. The rest of the scenario name indicates which fields in which tables were changed and by what percentage. The name of the scenario outlined in green is “Sc1d_Site Selection TransportationPolicies.UnitCost by -15.0 CustomerDemand.Quantity by -15.0”. So, this is the sensitivity scenario where both the transportation cost and the demand quantity are reduced by 15% as compared to the values in the input tables.
- The sensitivity scenarios each have all 5 items the original scenario had assigned to it also assigned to them.
- In addition, the sensitivity scenario items have been created and been assigned to the correct sensitivity scenarios.
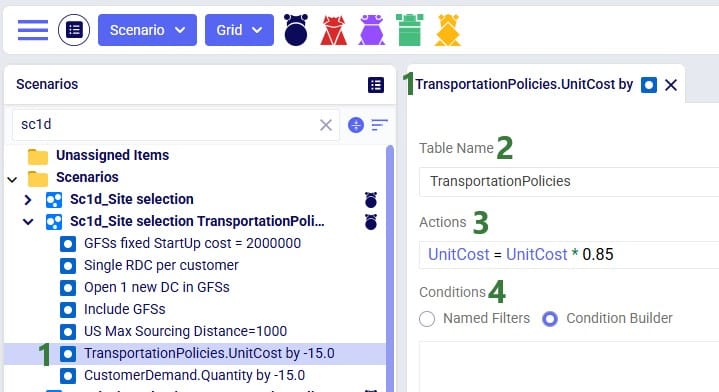
As an example of the sensitivity scenario items that are being created and assigned to the sensitivity scenarios as part of the S@S process, let us have a look at one of these newly created scenario items:
- The “TransportationPolicies.UnitCost by -15.0” scenario item has been selected and its configuration is shown on the right-hand side.
- Table Name: Transportation Policies – the table the change is being made to.
- Actions: UnitCost = UnitCost * 0.85 – the change that is being made, which is to multiply the current value in the Unit Cost field by 0.85, so it is reduced by 15%.
- Conditions: none are applied here – the change is being made to all records in the transportation policies table.
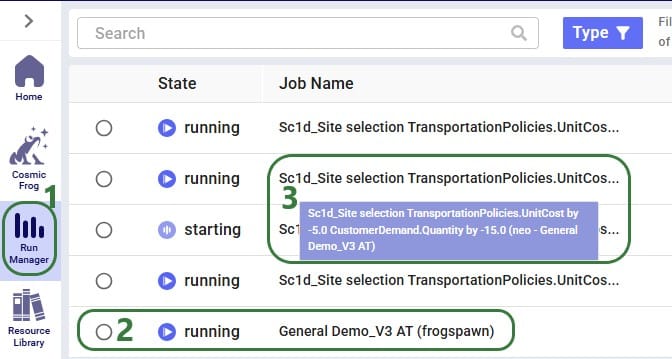
Once the sensitivity scenarios have been created, they are kicked off to all be run simultaneously. Users can have a look in the Run Manager application on the Optilogic platform to track their progress:
- On the Optilogic platform, select Run Manager as the application to open on the left-hand side of the screen. Should the Run Manager icon not be visible, then click on the icon with 3 dots (not shown here), which will show any applications that were not visible yet.
- The overall job for this batch of Sensitivity at Scale scenarios is listed here, with the identifier of “frogspawn” for S@S added to it in parenthesis.
- Each of the individual sensitivity scenarios that are being run is listed separately as a job too. Hovering over the Job Name will show the complete name in the blue tooltip. State will indicate whether the scenario is running still or if it has already completed. State will indicate “Error” in case the scenario could not run to completion. User can also view job info such as (error) logs, resource usage, etc. for the selected scenario on the right-hand side of the screen (not shown in screenshot above).
S@S Scenario Outputs
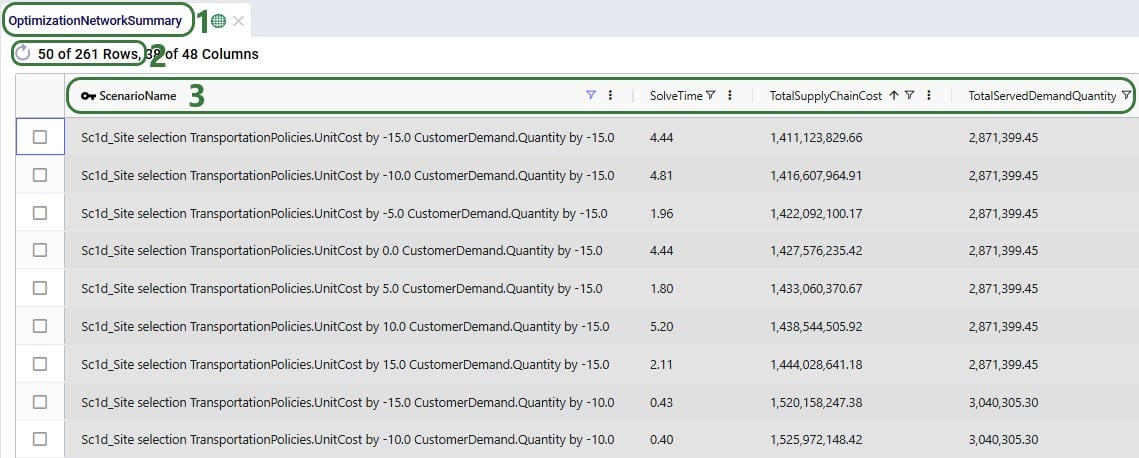
Once a S@S scenario finishes, its outputs are available for review in Cosmic Frog. As with other models and scenarios, users can review outputs through output tables, maps, and graphs/charts/dashboards in the Analytics module. Here we will just show the Optimization Network Summary output table and a cost comparison chart as example outputs. Depending on the model and technology run, users may want to look at different outputs to best understand them.
- The Sc1d_Site selection scenario and its sensitivity scenarios were run using the network optimization (Neo) engine. A good starting point for reviewing outputs is the Optimization Network Summary output table.
- The table has been filtered to only show the Sc1d scenario and its sensitivity scenarios, so 50 rows are visible in the grid (not all are captured in the screenshot).
- We have chosen to focus on a few columns in this table to start understanding the outputs: Scenario Name, Solve Time, Total Supply Chain Cost (sorted in ascending order), and Total Served Demand Quantity. As generally expected, the scenario with both the demand and transportation costs reduced by 15% (the first one in the list) has the lowest overall supply chain cost.
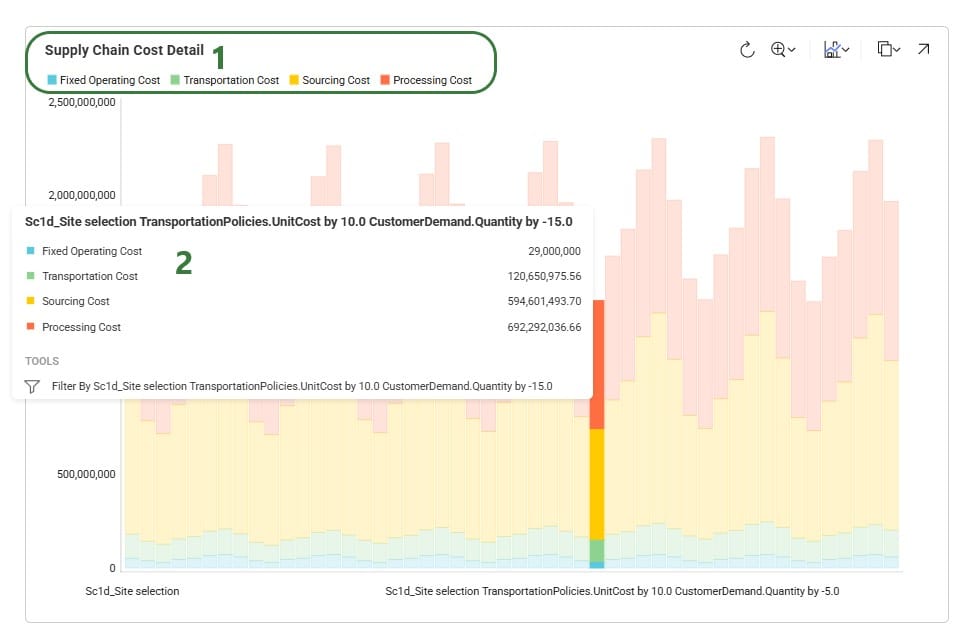
To understand how the costs are divided over the different cost types and how they compare by scenario, we can look at following Supply Chain Cost Detail graph in the Analytics module:
- For each scenario, a bar is drawn in the chart where the colors indicate the cost bucket: blue for fixed operating cost, green for transportation cost, yellow for sourcing cost, and red for processing cost. What stands out here is that even though the cost sensitivity was on transportation costs, these do not make up the majority of the total cost, which are mostly driven by sourcing and processing costs. Since the sourcing costs are unit based, the scenarios where there is less demand are the ones with the lowest sourcing cost and therefore lowest overall total supply chain cost.
- Hovering over an individual bar in the chart shows the detailed cost breakdown for the particular scenario.