

Here we will cover the options a Cosmic Frog user has for modeling transportation costs when using the Neo Optimization engine. The different fields that can be populated and how the calculations under the hood work will be explained in detail.
There are many ways in which transportation can be costed in real life supply chains. The Transportation Policies table contains 4 cost fields to help users model costs as close as possible to reality. These fields are: Unit Cost, Fixed Cost, Duty Rate and Inventory Carrying Cost Percentage. Not all these costs need to be used: the one(s) that are applicable should be populated and the others can be left blank. The way some of these costs work depends on additional information specified in other fields, which will be explained as well.
Note that in the screenshots throughout this documentation some fields in the Cosmic Frog tables have been moved so they could be shown together in a screenshot. You may need to scroll right to see the same fields in your Cosmic Frog model tables and they may be in a different order.
We will first discuss the input fields with the calculations and some examples; at the end of the document an overview is given of how the cost inputs translate to outputs in the optimization output tables.
This field is used for transportation costs that increase when the amount of product being transported increases and/or the transportation distance or time increases. As there are quite a few different measures based on which costs can depend on the amount of product that is transported (e.g. $2 per each, or $0.01 per each per mile, or $10 per mile for a whole shipment of 1000 units, etc.) there is a Unit Cost UOM field that specifies how the cost specified in the Unit Cost field should be applied. In a couple of cases, the Average Shipment Size and Average Shipment Size UOM fields must be specified too as we need to know the total number of shipments for the total Unit Cost calculation. The following table provides an overview of the Unit Cost UOM options and explains how the total Unit Costs are calculated for each UOM:


With the settings as in the screenshot above, total Unit Costs will be calculated as follows for beds, pillows, and alarm clocks going from DC_Reno to CUST_Phoenix:
The Unit Cost field can contain a single numeric value (as in the examples above), a step cost specified in the Step Costs table, a rate specified in the Transportation Rates table, or a custom cost function.
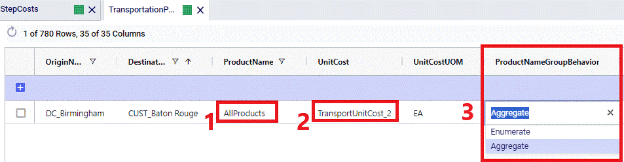
If stepped costs are used as the Unit Cost for Transportation Policies that use Groups in the Product Name field, then the Product Name Group Behavior field determines how these stepped costs are applied:
See following screenshots for an example of using stepped costs in the Unit Cost field and the difference in cost calculations for when Product Name Group Behavior is set to Enumerate vs Aggregate:
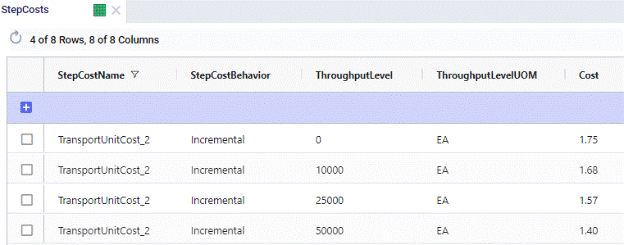
On the Step Costs table (screenshot above), the stepped costs we will be using in the Unit Cost field on the Transportation policies table are specified. All records with the same Step Cost Name (TransportUnitCost_2 here) make up 1 set of stepped costs. The Step Cost Behavior is set to Incremental here, meaning that discounted costs apply from the specified throughput level only, not to all items once we go over a certain throughput. So, in this example, the per unit cost for units 0 through 10,000 is $1.75, $1.68 for units 10,001 through 25,000, $1.57 for units 25,001 through 50,000, and $1.40 for all units over 50,000.
The configuration in the Transportation Policies table looks as follows:
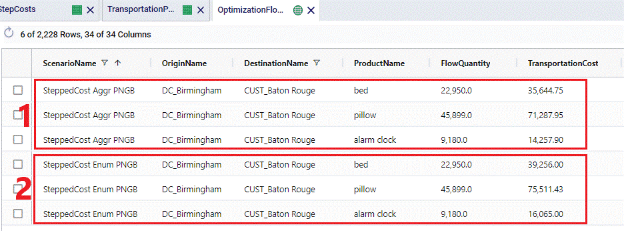
The following screenshot shows the outputs on the Optimization Flow Summary table of 2 scenarios that were run with these stepped costs, 1 scenario used the Enumerate option for the Product Name Group Behavior and the other 1 used the Aggregate option. The cost calculations are explained below the screenshot.
The Fixed Cost field can be used to apply a fixed cost to each shipment for the specified origin-destination-product-mode combination. An average shipment size needs to be specified to be able to calculate the number of shipments from the amount of product that is being transported. When calculating the number of shipments, the result can contain fractions of shipments, e.g. 2.8 or 5.2. If desirable, these can be rounded up to the next integer (e.g. 3 and 6 respectively) by setting the Fixed Cost Rule field to Treat As Full. Note however that using this setting can increase model runtimes, and using the default Prorate setting is recommended in most cases.
In summary, The Fixed Cost field therefore works together with the Fixed Cost Rule, Average Shipment Size, and Average Shipment Size UOM fields. The following table shows how the calculations work:

The Fixed Cost field can contain a single numeric value, or a step cost specified in the Step Costs table.
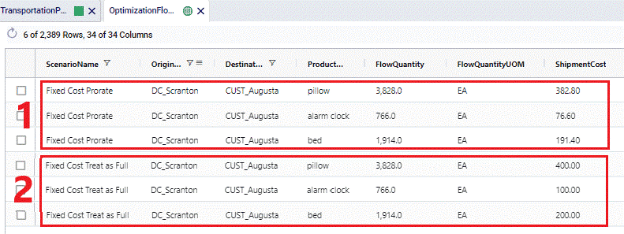
Following example shows how Fixed Costs are calculated on the DC_Scranton – CUST_Augusta lane and illustrates the difference between setting the Fixed Cost Rule to Prorate vs Treat As Full

This setup in the Transportation Policies table means that the cost for 1 shipment with on average 1,000 units on it is $100. 2 scenarios were run with this cost setup, 1 where Fixed Cost Rule was set to Prorate and 1 where it was set to Treat As Full. Following screenshot shows the outputs of these 2 scenarios:
For Fixed Costs on Transportation Policies that use Groups in the Product Name field, the Product Name Group Behavior field determines how these fixed costs are applied:
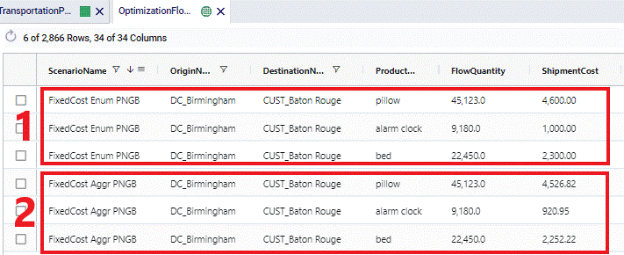
See following screenshots for an example of using Fixed Costs where the Fixed Cost Rule is set to Treat As Full and the difference in cost calculations for when Product Name Group Behavior is set to Enumerate vs Aggregate:
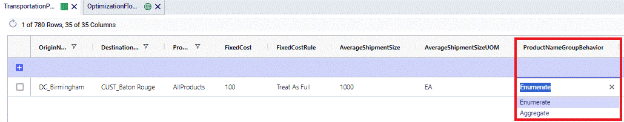
The transportation policy from DC_Birmingham to CUST_Baton Rouge uses the AllProducts group as the ProductName. This Group contains all 3 products being modelled: beds, pillows, and alarm clocks. The costs on this policy are a fixed cost of $100 per shipment, where an average shipment contains 1,000 units. The Fixed Cost Rule is set to Treat As Full meaning that the number of shipments will be rounded up to the next integer. Depending on the Product Name Group Behavior field this is done for the flow of each product individually (when set to Enumerate) or done for the flow of all 3 products together (when set to Aggregate):
When products are imported or exported from/to different countries, there may be cases where duties need to be paid. Cosmic Frog enables you to capture these costs by using the Duty Rate field on the Transportation Policies table. In this field you can specify the percentage of the Product Value (as specified on the Products table) that will be incurred as duty. If this percentage is for example 9%, you need to enter a value of 9 into the Duty Rate field. The calculation of total duties on a lane is as follows: Flow Quantity * Product Value * Duty Rate.
The following screenshots show the Product Value of beds, pillows and alarm clocks in the Products table, the Duty Rate set to 10% on the DC_Birmingham to CUST_Nashville lane in the Transportation Policies table, and the resulting Duty Costs in the Optimization Flow Summary table, respectively.
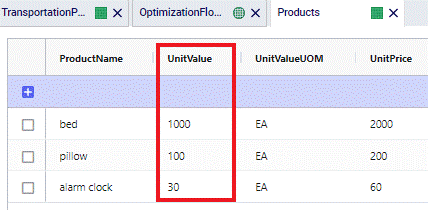
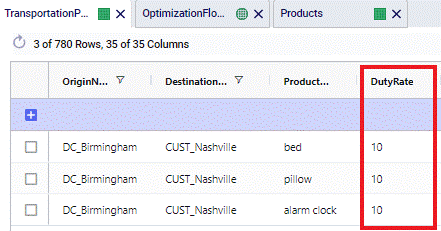
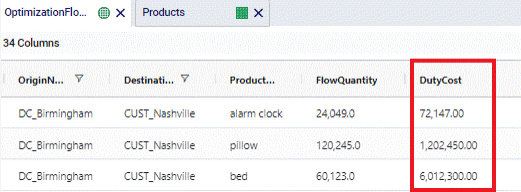
Alarm clocks have a Product Value of $30. With a Duty Rate of 10% and moving 24,049 from DC_Birmingham to CUST_Nashville, the resulting Duty Cost = 24,049 * $30 * 0.1 = $72,147.
If in transit inventory holding costs need to be calculated, the Inventory Carrying Cost Percentage field on the Transportation Policies table can be used. The value entered here will be used as the percentage of product value (specified on the Products table) to incur the in transit holding costs. If the Inventory Carrying Cost Percentage is 13%, then enter a value of 13 into this field. This percentage is interpreted as an annual percentage, so the in transit holding cost is then prorated based on transit time. The calculation of the in transit holding costs becomes: Flow Quantity * Product Value * Inventory Carrying Cost Percentage * Transit Time (in days) / 365.
Note that there is also an Inventory Carrying Cost Percentage field in the Model Settings table. If this is set to a value greater than 0 and there is no value specified in the Transportation Policies table, the value from the Model Settings table is automatically used for inventory carrying cost calculations, including in transit holding costs. If there are values specified in both tables, the one(s) in the Transportation Policies table take precedence for In Transit Holding Cost calculations.
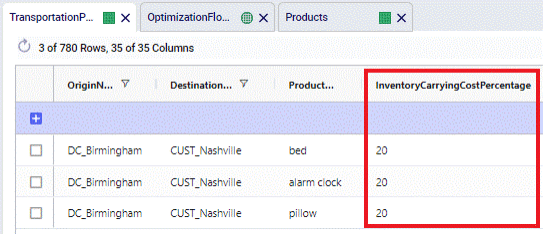
The following screenshots show the Inventory Carrying Cost Percentage set to 20% on the DC_Birmingham to CUST_Nashville lane in the Transportation Policies table, and the resulting In Transit Holding Costs in the Optimization Flow Summary table, respectively. The Product Values are as shown in the screenshot of the Products table in the previous section on Duty Rates.
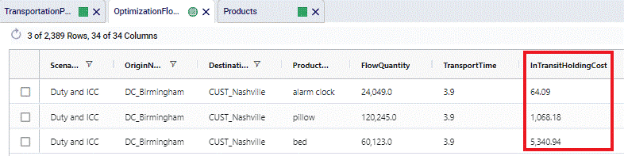
For Pillows, the Product Value set on the Products Table is $100. When 120,245 units are moved from DC_Birmingham to CUST_Nashville, which takes 3.8909 hours (214 MI / 55 MPH), the In Transit Holding Costs are calculated as follows: 120,245 (units) * $100 (product value) * 0.2 (Carrying Cost Percentage) * (3.8909 HR (transport time) / 24 (HRs in a day)) / 365 (days in a year) = $1,068.18.
The following table gives an overview of how the inputs into the 4 cost fields on the Transportation Policies table translate to outputs in multiple optimization output tables. The table contains the field names in the output tables and shows from which input field they result.
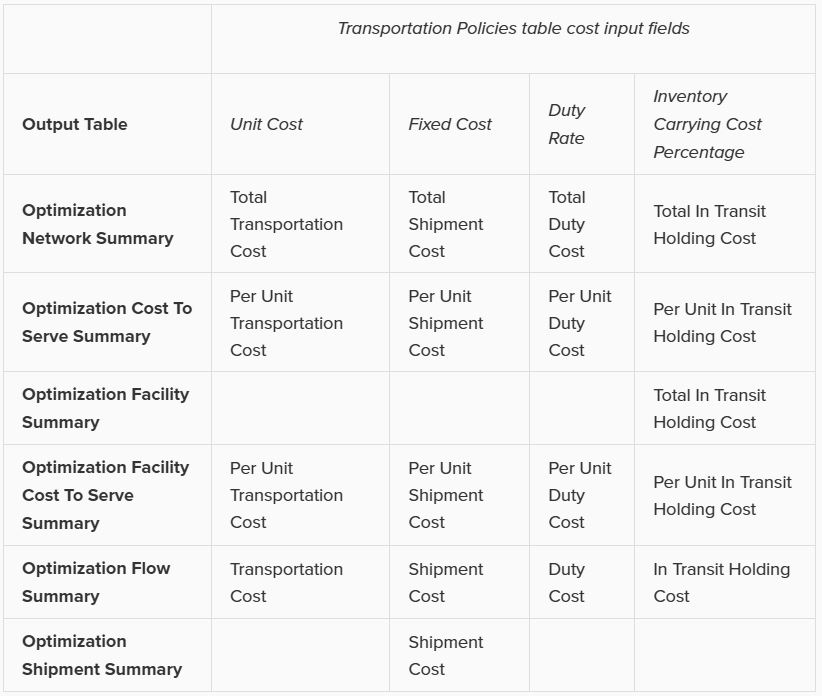
Note that the 4 different types of transportation costs are also included in the Landed Cost (Optimization Demand Summary table) and Parent Node Cost (Optimization Cost To Serve Parent Information Report table) calculations.

Here we will cover the options a Cosmic Frog user has for modeling transportation costs when using the Neo Optimization engine. The different fields that can be populated and how the calculations under the hood work will be explained in detail.
There are many ways in which transportation can be costed in real life supply chains. The Transportation Policies table contains 4 cost fields to help users model costs as close as possible to reality. These fields are: Unit Cost, Fixed Cost, Duty Rate and Inventory Carrying Cost Percentage. Not all these costs need to be used: the one(s) that are applicable should be populated and the others can be left blank. The way some of these costs work depends on additional information specified in other fields, which will be explained as well.
Note that in the screenshots throughout this documentation some fields in the Cosmic Frog tables have been moved so they could be shown together in a screenshot. You may need to scroll right to see the same fields in your Cosmic Frog model tables and they may be in a different order.
We will first discuss the input fields with the calculations and some examples; at the end of the document an overview is given of how the cost inputs translate to outputs in the optimization output tables.
This field is used for transportation costs that increase when the amount of product being transported increases and/or the transportation distance or time increases. As there are quite a few different measures based on which costs can depend on the amount of product that is transported (e.g. $2 per each, or $0.01 per each per mile, or $10 per mile for a whole shipment of 1000 units, etc.) there is a Unit Cost UOM field that specifies how the cost specified in the Unit Cost field should be applied. In a couple of cases, the Average Shipment Size and Average Shipment Size UOM fields must be specified too as we need to know the total number of shipments for the total Unit Cost calculation. The following table provides an overview of the Unit Cost UOM options and explains how the total Unit Costs are calculated for each UOM:
With the settings as in the screenshot above, total Unit Costs will be calculated as follows for beds, pillows, and alarm clocks going from DC_Reno to CUST_Phoenix:
The Unit Cost field can contain a single numeric value (as in the examples above), a step cost specified in the Step Costs table, a rate specified in the Transportation Rates table, or a custom cost function.
If stepped costs are used as the Unit Cost for Transportation Policies that use Groups in the Product Name field, then the Product Name Group Behavior field determines how these stepped costs are applied:
See following screenshots for an example of using stepped costs in the Unit Cost field and the difference in cost calculations for when Product Name Group Behavior is set to Enumerate vs Aggregate:
On the Step Costs table (screenshot above), the stepped costs we will be using in the Unit Cost field on the Transportation policies table are specified. All records with the same Step Cost Name (TransportUnitCost_2 here) make up 1 set of stepped costs. The Step Cost Behavior is set to Incremental here, meaning that discounted costs apply from the specified throughput level only, not to all items once we go over a certain throughput. So, in this example, the per unit cost for units 0 through 10,000 is $1.75, $1.68 for units 10,001 through 25,000, $1.57 for units 25,001 through 50,000, and $1.40 for all units over 50,000.
The configuration in the Transportation Policies table looks as follows:
The following screenshot shows the outputs on the Optimization Flow Summary table of 2 scenarios that were run with these stepped costs, 1 scenario used the Enumerate option for the Product Name Group Behavior and the other 1 used the Aggregate option. The cost calculations are explained below the screenshot.
The Fixed Cost field can be used to apply a fixed cost to each shipment for the specified origin-destination-product-mode combination. An average shipment size needs to be specified to be able to calculate the number of shipments from the amount of product that is being transported. When calculating the number of shipments, the result can contain fractions of shipments, e.g. 2.8 or 5.2. If desirable, these can be rounded up to the next integer (e.g. 3 and 6 respectively) by setting the Fixed Cost Rule field to Treat As Full. Note however that using this setting can increase model runtimes, and using the default Prorate setting is recommended in most cases.
In summary, The Fixed Cost field therefore works together with the Fixed Cost Rule, Average Shipment Size, and Average Shipment Size UOM fields. The following table shows how the calculations work:
The Fixed Cost field can contain a single numeric value, or a step cost specified in the Step Costs table.
Following example shows how Fixed Costs are calculated on the DC_Scranton – CUST_Augusta lane and illustrates the difference between setting the Fixed Cost Rule to Prorate vs Treat As Full
This setup in the Transportation Policies table means that the cost for 1 shipment with on average 1,000 units on it is $100. 2 scenarios were run with this cost setup, 1 where Fixed Cost Rule was set to Prorate and 1 where it was set to Treat As Full. Following screenshot shows the outputs of these 2 scenarios:
For Fixed Costs on Transportation Policies that use Groups in the Product Name field, the Product Name Group Behavior field determines how these fixed costs are applied:
See following screenshots for an example of using Fixed Costs where the Fixed Cost Rule is set to Treat As Full and the difference in cost calculations for when Product Name Group Behavior is set to Enumerate vs Aggregate:
The transportation policy from DC_Birmingham to CUST_Baton Rouge uses the AllProducts group as the ProductName. This Group contains all 3 products being modelled: beds, pillows, and alarm clocks. The costs on this policy are a fixed cost of $100 per shipment, where an average shipment contains 1,000 units. The Fixed Cost Rule is set to Treat As Full meaning that the number of shipments will be rounded up to the next integer. Depending on the Product Name Group Behavior field this is done for the flow of each product individually (when set to Enumerate) or done for the flow of all 3 products together (when set to Aggregate):
When products are imported or exported from/to different countries, there may be cases where duties need to be paid. Cosmic Frog enables you to capture these costs by using the Duty Rate field on the Transportation Policies table. In this field you can specify the percentage of the Product Value (as specified on the Products table) that will be incurred as duty. If this percentage is for example 9%, you need to enter a value of 9 into the Duty Rate field. The calculation of total duties on a lane is as follows: Flow Quantity * Product Value * Duty Rate.
The following screenshots show the Product Value of beds, pillows and alarm clocks in the Products table, the Duty Rate set to 10% on the DC_Birmingham to CUST_Nashville lane in the Transportation Policies table, and the resulting Duty Costs in the Optimization Flow Summary table, respectively.
Alarm clocks have a Product Value of $30. With a Duty Rate of 10% and moving 24,049 from DC_Birmingham to CUST_Nashville, the resulting Duty Cost = 24,049 * $30 * 0.1 = $72,147.
If in transit inventory holding costs need to be calculated, the Inventory Carrying Cost Percentage field on the Transportation Policies table can be used. The value entered here will be used as the percentage of product value (specified on the Products table) to incur the in transit holding costs. If the Inventory Carrying Cost Percentage is 13%, then enter a value of 13 into this field. This percentage is interpreted as an annual percentage, so the in transit holding cost is then prorated based on transit time. The calculation of the in transit holding costs becomes: Flow Quantity * Product Value * Inventory Carrying Cost Percentage * Transit Time (in days) / 365.
Note that there is also an Inventory Carrying Cost Percentage field in the Model Settings table. If this is set to a value greater than 0 and there is no value specified in the Transportation Policies table, the value from the Model Settings table is automatically used for inventory carrying cost calculations, including in transit holding costs. If there are values specified in both tables, the one(s) in the Transportation Policies table take precedence for In Transit Holding Cost calculations.
The following screenshots show the Inventory Carrying Cost Percentage set to 20% on the DC_Birmingham to CUST_Nashville lane in the Transportation Policies table, and the resulting In Transit Holding Costs in the Optimization Flow Summary table, respectively. The Product Values are as shown in the screenshot of the Products table in the previous section on Duty Rates.
For Pillows, the Product Value set on the Products Table is $100. When 120,245 units are moved from DC_Birmingham to CUST_Nashville, which takes 3.8909 hours (214 MI / 55 MPH), the In Transit Holding Costs are calculated as follows: 120,245 (units) * $100 (product value) * 0.2 (Carrying Cost Percentage) * (3.8909 HR (transport time) / 24 (HRs in a day)) / 365 (days in a year) = $1,068.18.
The following table gives an overview of how the inputs into the 4 cost fields on the Transportation Policies table translate to outputs in multiple optimization output tables. The table contains the field names in the output tables and shows from which input field they result.
Note that the 4 different types of transportation costs are also included in the Landed Cost (Optimization Demand Summary table) and Parent Node Cost (Optimization Cost To Serve Parent Information Report table) calculations.


