

The only constant is change. When building our supply chains, the “optimal” design doesn’t only mean lowest cost. What happens if (or perhaps when) a disruption occurs? Fragile, low-cost supply chains can end up costing more in the long run if they aren’t resilient to the dynamic nature of today’s world.
We believe that optimality includes resilience. That’s why every Cosmic Frog run includes a risk rating from our DART risk engine.
Every Cosmic Frog run outputs an Opti Risk score. The Opti Risk score is an aggregate measure of the overall supply chain risk. It includes the following sub-categories:
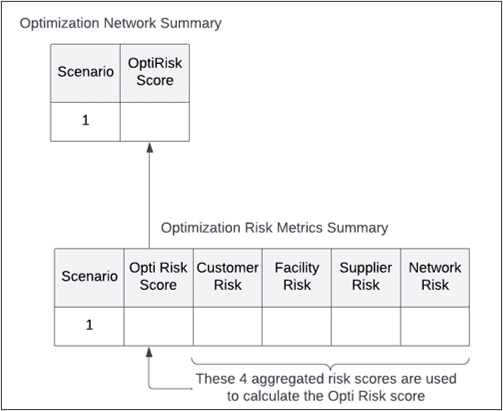
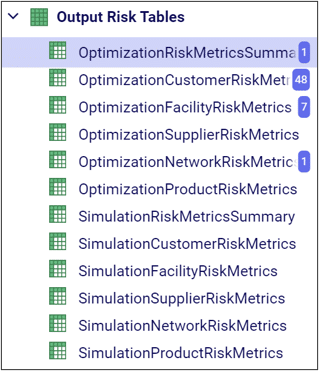
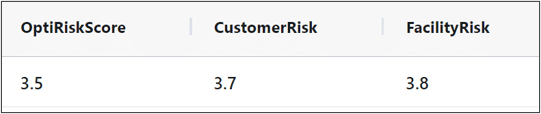
After running a model, you can find the Opti Risk score (as well as the scores for each of the sub-categories) in the output risk tables. The Opti Risk score can also be found in the OptimizationNetworkSummary table.
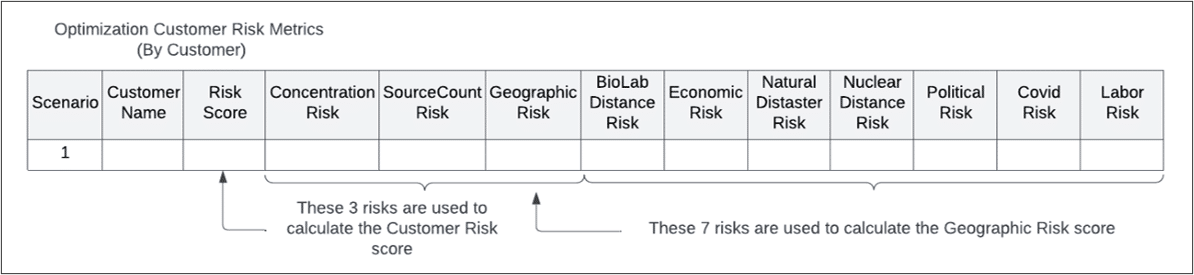
The overall Customer Risk score is an aggregation of each individual customer’s risk described in the OptimizationCustomerRiskMetrics or SimulationCustomerRiskMetrics tables. In each scenario, there is one risk score per customer per period.
Each customer risk score includes:
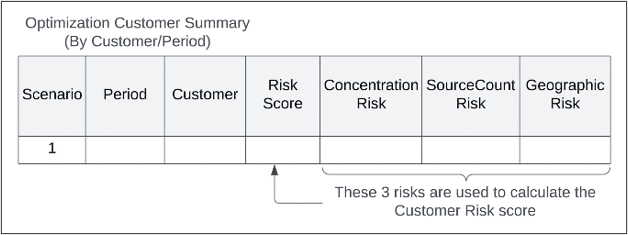
For each sub-category, the geographic risk score is also an aggregation of several risk factors:
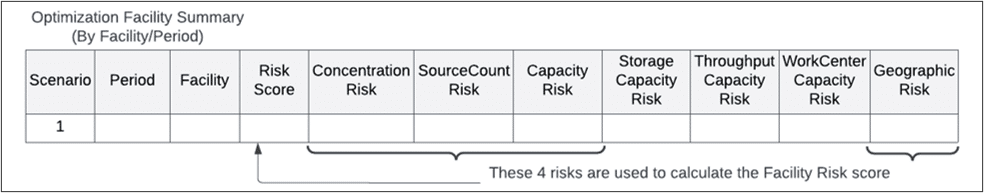
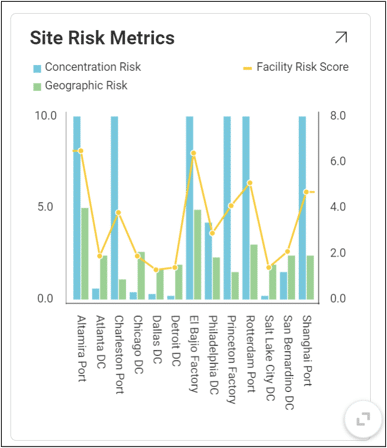
Like the customer risk score, the overall facility risk score is an aggregation of risk across all facilities in your supply chain. In the FacilityRiskMetric tables, there is an individual risk score per facility per period.
The facility risk score includes:
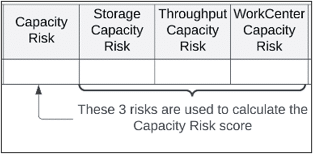
The capacity risk has three sub-components:
The facility geographic risk has the same components as the customer geographic risk.
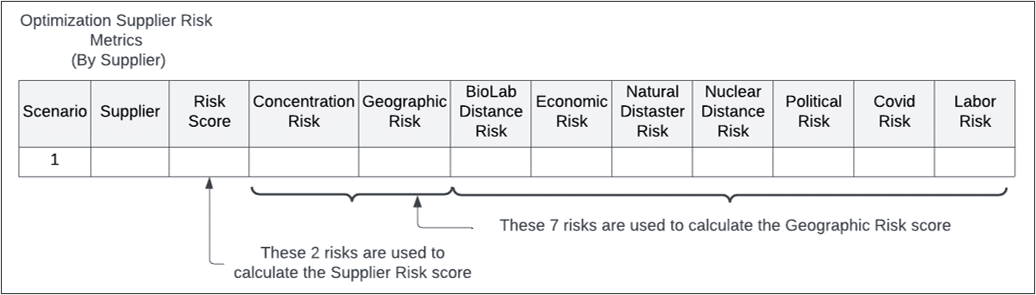
The supplier risk is calculated per supplier per period and includes:
Both the concentration and geographic risks include the same elements as described previously.
Network risk differs from the other risk scores in that it is not tied to a specific supply chain element. There is only one network risk score per scenario, and it includes:
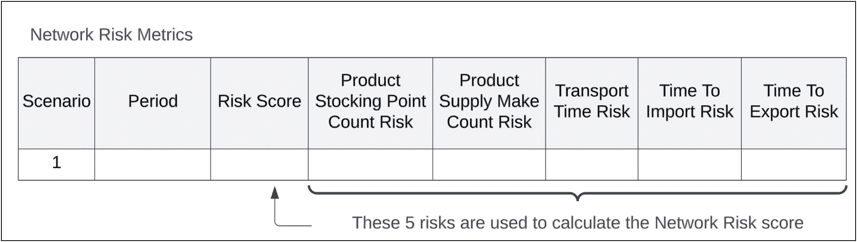
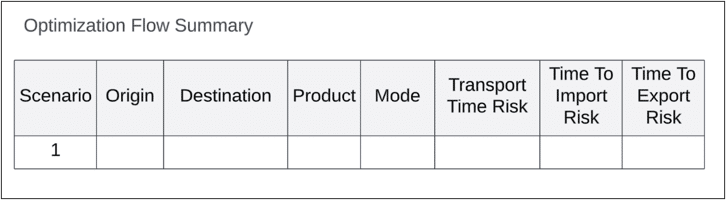
The transport and import/export time risks are aggregated across individual origin/destination pairs for every product and transport mode. The individual risk scores can be found in the OptimizationFlowSummary table.
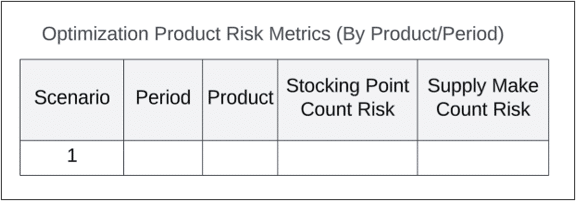
The stocking point count and supply make count risks are aggregations across every product and period. The individual risk scores can be found in the ProductRiskMetrics tables.
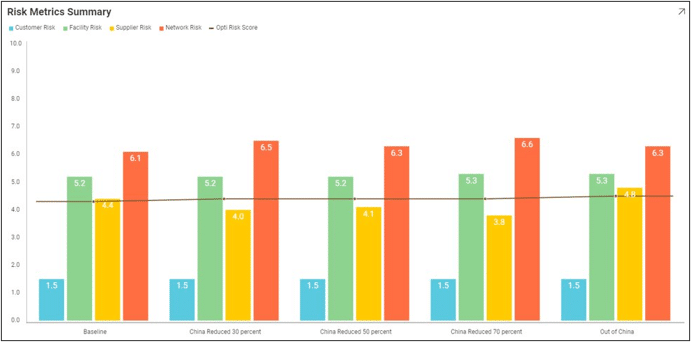
We can use our visualization tools to get a better sense of how risk varies across design scenarios.

The only constant is change. When building our supply chains, the “optimal” design doesn’t only mean lowest cost. What happens if (or perhaps when) a disruption occurs? Fragile, low-cost supply chains can end up costing more in the long run if they aren’t resilient to the dynamic nature of today’s world.
We believe that optimality includes resilience. That’s why every Cosmic Frog run includes a risk rating from our DART risk engine.
Every Cosmic Frog run outputs an Opti Risk score. The Opti Risk score is an aggregate measure of the overall supply chain risk. It includes the following sub-categories:
After running a model, you can find the Opti Risk score (as well as the scores for each of the sub-categories) in the output risk tables. The Opti Risk score can also be found in the OptimizationNetworkSummary table.
The overall Customer Risk score is an aggregation of each individual customer’s risk described in the OptimizationCustomerRiskMetrics or SimulationCustomerRiskMetrics tables. In each scenario, there is one risk score per customer per period.
Each customer risk score includes:
For each sub-category, the geographic risk score is also an aggregation of several risk factors:
Like the customer risk score, the overall facility risk score is an aggregation of risk across all facilities in your supply chain. In the FacilityRiskMetric tables, there is an individual risk score per facility per period.
The facility risk score includes:
The capacity risk has three sub-components:
The facility geographic risk has the same components as the customer geographic risk.
The supplier risk is calculated per supplier per period and includes:
Both the concentration and geographic risks include the same elements as described previously.
Network risk differs from the other risk scores in that it is not tied to a specific supply chain element. There is only one network risk score per scenario, and it includes:
The transport and import/export time risks are aggregated across individual origin/destination pairs for every product and transport mode. The individual risk scores can be found in the OptimizationFlowSummary table.
The stocking point count and supply make count risks are aggregations across every product and period. The individual risk scores can be found in the ProductRiskMetrics tables.
We can use our visualization tools to get a better sense of how risk varies across design scenarios.


