Blog
How to Minimize Risk in Santa’s Supply Chain
PUBLISHED ON:
December 21, 2022
Subscribe to Receive the Latest Supply Chain Design Resources
Did you know Santa is about 1,752 years old? St. Nicholas, as he was formerly known, was born around 270 A.D. and has aged surprisingly well, considering all the sweets and the harsh North Pole climate.
But secrets to good skincare aren’t all Santa has learned over the years. He’s also managed to build a solid supply chain strategy to deliver toys around the world. But has Santa considered the supply chain risk factors in his toy delivery strategy?
In anticipation of Christmas, we thought we’d have a bit of fun and build a Cosmic Frog supply chain design model to help Santa distribute gifts in the U.S., considering service (on-time gift delivery) and risk (to ensure reliability).
Santa’s Supply Chain Network Optimization Model
Santa needs to refill his sleigh with presents periodically. The elves distribute toys to storage locations with the items that he needs. So, how many locations should Santa use and where should they be located to minimize the amount of magic needed to get all the children their toys?
We built a model to help Santa optimize his supply chain to distribute presents using the 100 largest cities in the U.S.–one present per person. Santa needs to know:
- How many distribution centers does he need, and where should they be located?
- How can he use risk metrics to improve the resiliency of the network in case of severe weather?
Step 1: Greenfield + Network Optimization Scenarios
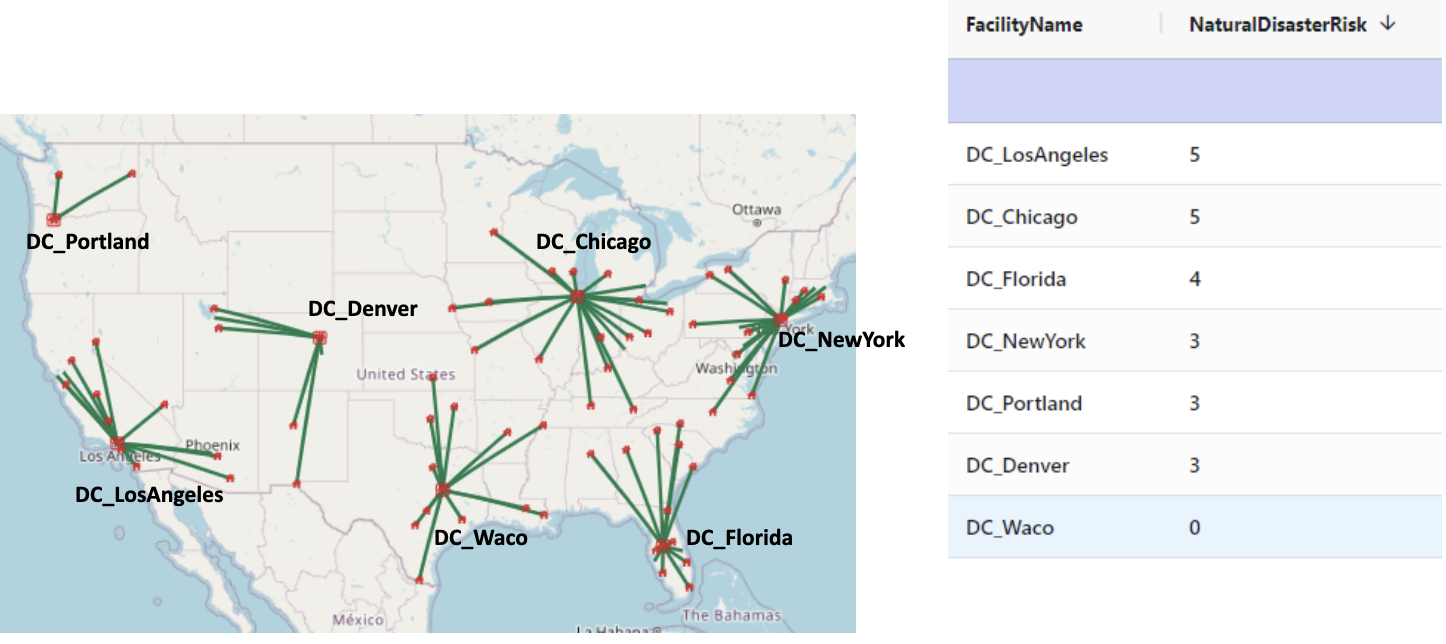
First, Santa used Cosmic Frog to identify how many distribution centers (DC) he would need to ensure all “customers” are within 600 miles of a facility.
——> The answer is 7 DCs
All runs in Cosmic Frog provide the latest risk score using external data sources. As it turns out, two of those DC locations have a relatively high natural disaster risk score of 5 (Chicago and Los Angeles).
Building a supply chain design based on cost alone is unwise in today’s world. Supply chain risk ratings must be considered to ensure that your supply chain can keep running regardless of disruption. You do this by knowing what the risks are that you are taking and planning accordingly. Santa of all people knows he must deliver his presents, come snow or shine!
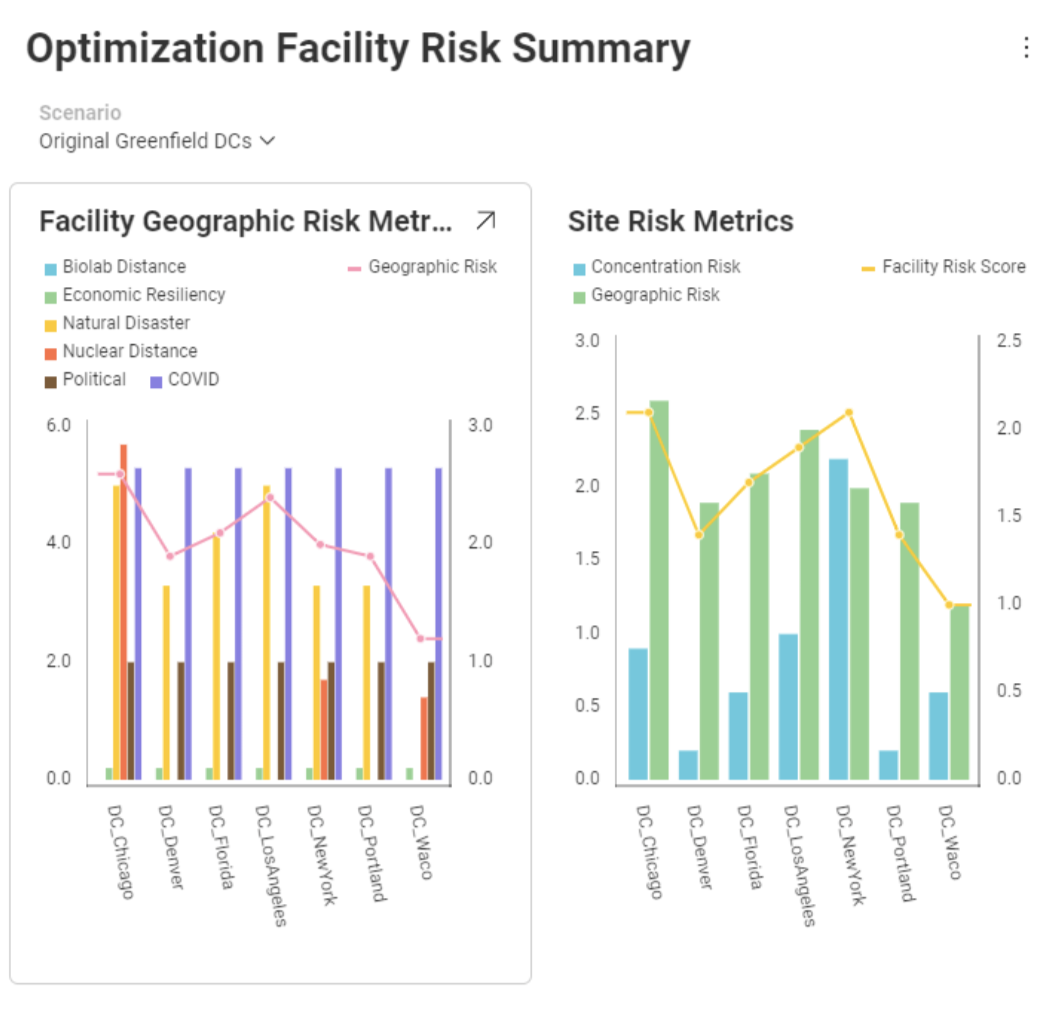
Step 2: Consider Alternate DCs with Lower Risk
Santa decided to move the location of the two DCs with a high natural disaster risk score more inland. This reduced the risk score from 5 to 1 and 3, respectively.
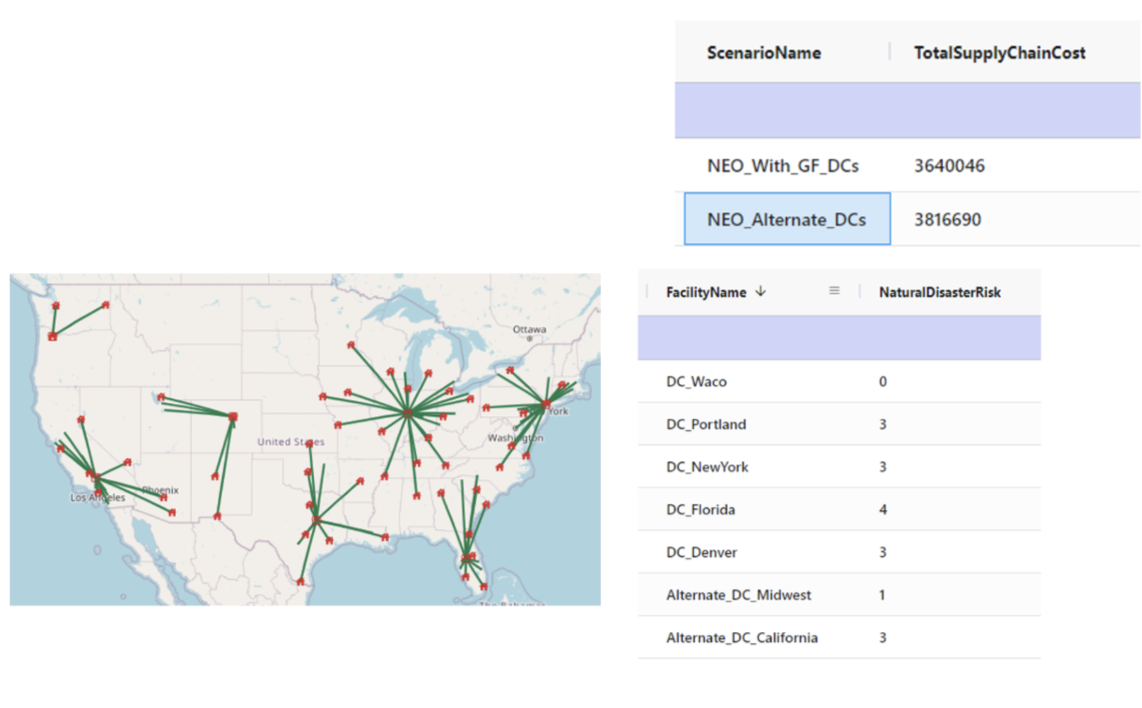
With lower risk, the cost increases by 4.85%. Santa decided this is a wise investment given all the children counting on him to deliver on Christmas Eve.
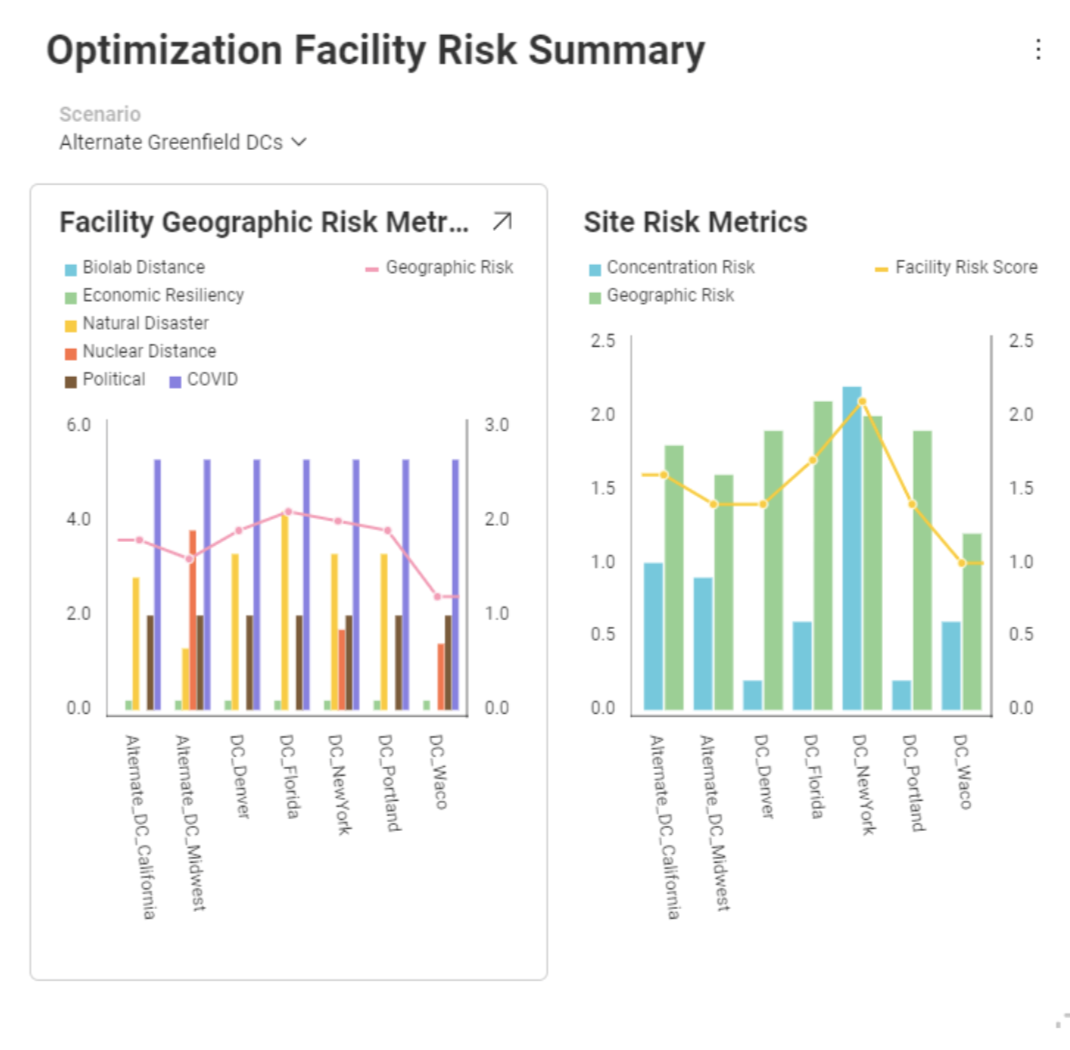
How Santa’s Supply Chain Model Is Built
Greenfield Scenario
100 customers, demand equal to city population
Max sourcing distance 600 miles
Objective: Minimize number of DCs
Optimization Scenario #1
Seven facilities from the Greenfield outputs
Objective: minimize cost with $1/mile/unit of demand
Optimization Scenario #2
Five facilities from the Greenfield outputs
Two adjusted facilities to lower natural disaster risk score
Objective: minimize cost with $1/mile/unit of demand
If Santa Can Do It, You Can Too!
There are endless supply chain use cases for Cosmic Frog, and you can get started risk-free today. Sign up for your free account.
Grow Your Knowledge
The 2025 CSCO Playbook: Leading with Influence, Speed, and Strategic Clarity
Discover how top CSCOs are leading in 2025 with influence, speed, and strategic clarity. This quick-read playbook reveals proven strategies to strengthen C-suite credibility, accelerate time-to-value, and build agile, resilient supply chains.
Lead Through the Shift: How Bold Supply Chain Design Turns Tariffs into Opportunity
Turn the new Trump tariffs into opportunity with supply chain design. Don’t wait for problems—use scenario planning for disruptions like tariff shocks, simulate possible outcomes, and create contingency playbooks to mitigate cost and risk.
