Published by
Published on
August 20, 2026



Supply chain leaders are answering two questions at once: what's the right call today, and what should the network look like next. Optilogic exists for both and keeps your team ahead of the next shift. It's a capability your team exercises continuously, turning the data you already have into a decision-ready answer in days, and keeping your network's next move ready before the window to act on it closes.
August's releases sharpen both sides of that. Ada answers three more questions than it could last month and holds every answer to a stricter standard of proof. Cosmic Frog makes it easier to spot what matters in your data and shape it the way your team actually works. And DataStar gives you more visibility into what a workflow just did, right where you're already working.
When Ada launched, it answered the two questions most teams ask first: where should things be, and how should freight move? That's network design and transportation, and it's what Ada has been answering since day one.
This month, Ada takes on three more questions your team is already asking:
"Where should we be holding inventory, and what does it actually cost to protect our service level?" Ada now reasons across your full network at once — not one node at a time — to place safety stock where it belongs and show you what a given service target costs to deliver. (Powered by Cyclo, Optilogic's multi-echelon inventory optimization engine.)
"Where is our network most exposed, and where should we be paying attention?" Ada can now score risk across your network — concentrated lanes, single-source dependencies, regions carrying more exposure than the rest — so you know where to focus before a disruption forces the question. (Powered by Dart, Optilogic's network risk scoring engine.)
"Will this plan actually hold up, or does it just look good on paper?" Ada can now stress-test a recommendation against real-world variability — demand swings, delayed lead times, capacity shocks — before you act on it, so what reaches leadership has already been pressure-tested. (Powered by Dendro, Optilogic's simulation-optimization engine.)
Where to build, how to move it, where to hold it, where the risk sits, and whether the plan survives contact with reality — Ada answers all of it, with the same data, no context-switching between tools.
Every step visible. Every output yours to validate. That's been true of Ada since day one — nothing happens without your approval, and every table, every assumption, every output is there for your team to open, check, and override. This month, Ada holds itself to that same standard internally, not just in what it shows you, but in what it's willing to say.
Every table reference, every run status, every filter applied — Ada now confirms it directly in that turn before it's stated back to you. No invented table names. No reporting a run as failed because it simply timed out. No silently filtering part of a model and describing results as if they cover the whole thing. Approval flows, unit comparisons, and scenario naming all proven.
Human judgment stays where it belongs — with your team. Ada isn't built to replace the validation step. It's built to make that step count for more: your team's review time goes toward refining the answer, not tracking down the backend details.
Reviewing and validating a model sometimes means scanning a grid, row by row, column by column, trying to catch the one number that's out of line. That's not analysis; that's proofreading. And the bigger the model, the easier it is to miss the thing that actually matters.
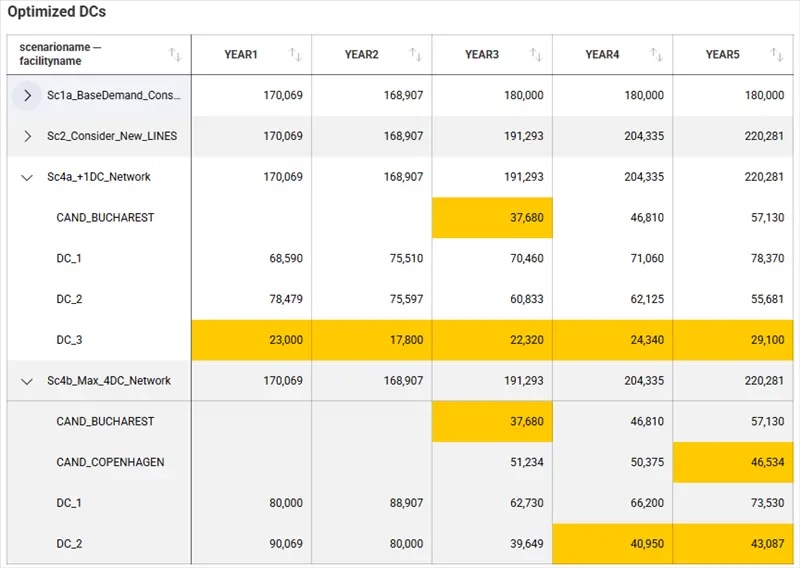
Now, conditional formatting in Cosmic Frog changes that. Cosmic Frog's Analytics tools now support color scales — red to yellow to green — and rules-based highlighting across Grid, Pivot, Text View, Bar, and Column visualizations. Colors do the work of highlighting outliers, trends, and exceptions at a glance.
Alongside that, visualization links are now available. Jump straight from a chart to a related dashboard, or out to an external URL, without backing out and re-navigating. Small thing. Saves real time, every single day, across every team that lives in dashboards.
A few smaller improvements came along too: better label handling, sharper tooltips, more responsive date pickers.
Learn more about Analytics in Cosmic Frog →
Flexibility matters most where you spend the most time — in the grid itself.
Your Data tables now support multiple row groups, so you can group by more than one field at the same time, whether you're in the standard grouped view or Pivot Mode. If you've ever needed to slice input or output data by region and then by product, and then by customer on top of that, you know exactly why this matters.
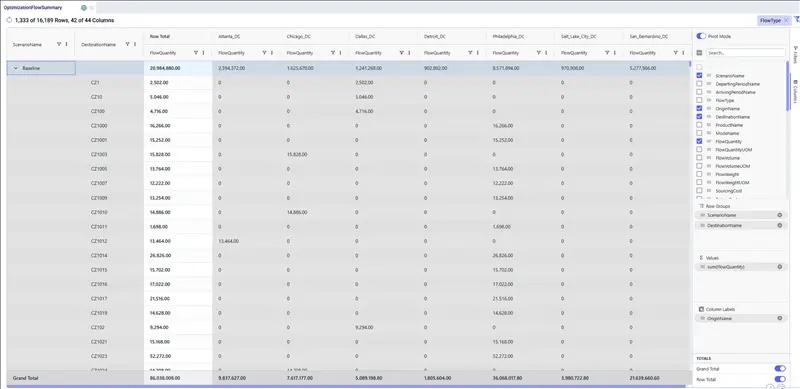
Pivot Mode also picks up a dedicated Totals section in the Columns panel — independent toggles for a grand total row and a grand total column, so you're not building workaround formulas just to see a number you should've had by default. And pinned column state now persists when a table is reopened, so you're not re-pinning the same three columns every single morning.
Learn more about Row Grouping, Aggregation, and Pivoting in Cosmic Frog →
DataStar is built to do the work between raw data and supply chain decision-making. This month’s release is about exactly that: seeing what happened, right where you're already working.
After running a task in DataStar, Contextual Task Results puts the answer right where the question was asked. The Task Results tab now shows execution status, a plain-English summary of what happened, and a preview of up to 100 rows — directly in the bottom panel, no navigating away required.
So, you can see it and validate it without opening a separate table or digging through logs. Keep building the next step of your workflow with a faster, easier way to confirm what changed.
.png)
Learn more about getting started with DataStar →
All features are available now in the Optilogic platform. Have questions? Reach out to your Customer Success Manager or support@optilogic.com or visit our Help Center for documentation and tutorials.
Supply chain leaders are answering two questions at once: what's the right call today, and what should the network look like next. Optilogic exists for both and keeps your team ahead of the next shift. It's a capability your team exercises continuously, turning the data you already have into a decision-ready answer in days, and keeping your network's next move ready before the window to act on it closes.
August's releases sharpen both sides of that. Ada answers three more questions than it could last month and holds every answer to a stricter standard of proof. Cosmic Frog makes it easier to spot what matters in your data and shape it the way your team actually works. And DataStar gives you more visibility into what a workflow just did, right where you're already working.
When Ada launched, it answered the two questions most teams ask first: where should things be, and how should freight move? That's network design and transportation, and it's what Ada has been answering since day one.
This month, Ada takes on three more questions your team is already asking:
"Where should we be holding inventory, and what does it actually cost to protect our service level?" Ada now reasons across your full network at once — not one node at a time — to place safety stock where it belongs and show you what a given service target costs to deliver. (Powered by Cyclo, Optilogic's multi-echelon inventory optimization engine.)
"Where is our network most exposed, and where should we be paying attention?" Ada can now score risk across your network — concentrated lanes, single-source dependencies, regions carrying more exposure than the rest — so you know where to focus before a disruption forces the question. (Powered by Dart, Optilogic's network risk scoring engine.)
"Will this plan actually hold up, or does it just look good on paper?" Ada can now stress-test a recommendation against real-world variability — demand swings, delayed lead times, capacity shocks — before you act on it, so what reaches leadership has already been pressure-tested. (Powered by Dendro, Optilogic's simulation-optimization engine.)
Where to build, how to move it, where to hold it, where the risk sits, and whether the plan survives contact with reality — Ada answers all of it, with the same data, no context-switching between tools.
Every step visible. Every output yours to validate. That's been true of Ada since day one — nothing happens without your approval, and every table, every assumption, every output is there for your team to open, check, and override. This month, Ada holds itself to that same standard internally, not just in what it shows you, but in what it's willing to say.
Every table reference, every run status, every filter applied — Ada now confirms it directly in that turn before it's stated back to you. No invented table names. No reporting a run as failed because it simply timed out. No silently filtering part of a model and describing results as if they cover the whole thing. Approval flows, unit comparisons, and scenario naming all proven.
Human judgment stays where it belongs — with your team. Ada isn't built to replace the validation step. It's built to make that step count for more: your team's review time goes toward refining the answer, not tracking down the backend details.
Reviewing and validating a model sometimes means scanning a grid, row by row, column by column, trying to catch the one number that's out of line. That's not analysis; that's proofreading. And the bigger the model, the easier it is to miss the thing that actually matters.
Now, conditional formatting in Cosmic Frog changes that. Cosmic Frog's Analytics tools now support color scales — red to yellow to green — and rules-based highlighting across Grid, Pivot, Text View, Bar, and Column visualizations. Colors do the work of highlighting outliers, trends, and exceptions at a glance.
Alongside that, visualization links are now available. Jump straight from a chart to a related dashboard, or out to an external URL, without backing out and re-navigating. Small thing. Saves real time, every single day, across every team that lives in dashboards.
A few smaller improvements came along too: better label handling, sharper tooltips, more responsive date pickers.
Learn more about Analytics in Cosmic Frog →
Flexibility matters most where you spend the most time — in the grid itself.
Your Data tables now support multiple row groups, so you can group by more than one field at the same time, whether you're in the standard grouped view or Pivot Mode. If you've ever needed to slice input or output data by region and then by product, and then by customer on top of that, you know exactly why this matters.
Pivot Mode also picks up a dedicated Totals section in the Columns panel — independent toggles for a grand total row and a grand total column, so you're not building workaround formulas just to see a number you should've had by default. And pinned column state now persists when a table is reopened, so you're not re-pinning the same three columns every single morning.
Learn more about Row Grouping, Aggregation, and Pivoting in Cosmic Frog →
DataStar is built to do the work between raw data and supply chain decision-making. This month’s release is about exactly that: seeing what happened, right where you're already working.
After running a task in DataStar, Contextual Task Results puts the answer right where the question was asked. The Task Results tab now shows execution status, a plain-English summary of what happened, and a preview of up to 100 rows — directly in the bottom panel, no navigating away required.
So, you can see it and validate it without opening a separate table or digging through logs. Keep building the next step of your workflow with a faster, easier way to confirm what changed.
Learn more about getting started with DataStar →
All features are available now in the Optilogic platform. Have questions? Reach out to your Customer Success Manager or support@optilogic.com or visit our Help Center for documentation and tutorials.
Fill out the form to download the full content
.jpg)