
Published by
Jim Wilson
Published on
May 11, 2026


When planning for new facilities or market expansion, reducing transportation expenses and emissions without sacrificing customer service is a tricky problem to solve. The obvious solution is through reducing the distance between you and your customers, but you can't run an unlimited number of distribution centers. Finding the balance between unlimited distribution centers and high transportation costs requires some serious math—how do you narrow down site options before you get into the optimization model? That's where Greenfield analysis software comes in.
Greenfield analysis is commonly used for supply chain site selection, i.e. how many distribution centers (DCs) do I need, where, and what size?
Let's have a look at the basics of greenfield, and how to use Optilogic's intelligent greenfield analysis as a fast and simple, yet powerful way to narrow down facility options to a set of sensible candidates to analyze in a traditional network design model.
Sometimes called center of gravity analysis, greenfield analysis (GFA) is a supply chain network design method that solves the facility location problem.
Intelligent greenfield analysis examines market and industry conditions like your products, demand, and customer locations to determine how many distribution centers you need, where they should be located, and how large they should be to meet a defined service level.
Greenfield is typically a simpler precursor to traditional network design, which models detailed costs, capacities, policies, and constraints. With greenfield analysis, you can start with hundreds of potential location candidates, and by applying parameters, rapidly narrow down to a set of five to 10 for detailed consideration.
To perform greenfield analysis with Optilogic, you'll need only the following data tables:
GFA uses this information to map out the ideal location for production and warehousing facilities and distribution centers.
Greenfield and brownfield analysis answer two different questions about your supply chain network.
Greenfield analysis assumes a clean slate. You're solving for the optimal number, size, and location of facilities based purely on demand, cost, and service goals — without being constrained by what already exists. It's the right approach when you're entering a new market, planning a major expansion, or stress-testing whether your current network is anywhere close to optimal.
Brownfield analysis (BFA) starts with the network you already have. You're evaluating which existing facilities to keep, expand, contract, or close — and where new sites might fit alongside them. It's the right approach when you're rationalizing an inherited footprint, modeling post-acquisition consolidation, or planning incremental change rather than a full redesign. BFA is often used in situations like mergers or when new customers crop up in remote areas.
In Cosmic Frog, you don't have to choose one or the other. Intelligent Greenfield Analysis handles both — you can lock existing facilities as fixed in the model and let the engine recommend additions, or run a true greenfield with no constraints to see what an unconstrained network would look like. Most teams run both side-by-side: greenfield to define the ideal, brownfield to define the achievable, and a network optimization run to bridge the two.
GFA is a simple, fast, and effective way to kick-start a strategic supply chain network design plan. Below are the best reasons to consider implementing GFA into your supply chain network design workflow:
GFA helps manufacturers identify how many distribution centers and factories are necessary to create a smooth and efficient supply chain. The method establishes which customers can be serviced from a specific facility, the best number of facilities for a given supply chain, and the most cost-effective geographic location for each facility.
Because GFA can account for variables like your customer demand and their geographic locations, your budget, and even your customer service goals, the resulting DC placement minimizes transportation costs without sacrificing efficiency or customer satisfaction.
Because GFA identifies the most efficient locations for DCs using the distance between suppliers and customers and the resources available at each location, supply chain operations are more efficient with shorter lead times.
Optimized DC placement ensures locations can serve customers quickly and efficiently, which improves customer service.
Businesses can also use GFA to vet opportunities for expansion and capital expenditures such as new facilities and mergers and acquisitions.
Businesses can use GFA to choose DC locations less susceptible to supply chain disruptions like extreme weather events, political instability, or pandemic-related closures. The method can also be used to explore what-if scenarios for various demand and supply situations. These capabilities make GFA a strong way to secure supply chain resilience throughout ongoing economic volatility and global uncertainty in 2026.
What's the risk rating on your supply chain designs? Optilogic's Cosmic Frog provides a risk rating for every scenario.
Optilogic's Intelligent Greenfield Analysis offers capabilities above and beyond traditional greenfield analysis tools. You can:
Most greenfield tools answer one question: where should facilities go? Cosmic Frog answers several at once.
In a single greenfield run, the engine simultaneously solves for:
And because greenfield output flows directly into Cosmic Frog's network optimization (Neo) and simulation (Throg) engines, candidate locations from a greenfield run can be evaluated alongside:
The reason this matters: separating these decisions across point tools creates blind spots. A site that looks optimal on transportation cost alone may be suboptimal once inventory positioning, service levels, and risk are factored in. Modeling them together in one platform — starting with greenfield and progressing to a full network design — gives you a defensible answer the first time.
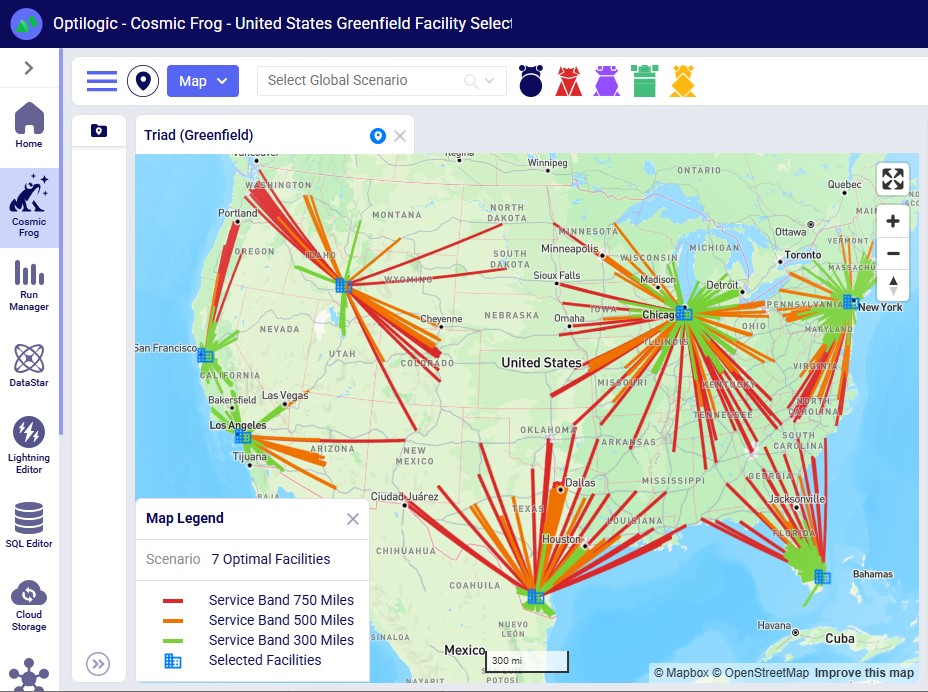
In Cosmic Frog, the greenfield engine is called Triad — named after Triadobatrachus, the oldest known frog species. Just as Triadobatrachus is considered the starting point for the evolution of all frogs, Triad serves as a great starting point for modeling projects too. Triad identifies three things in a single run:
Greenfield analysis solves quickly and is designed to be a starting point — its output is most useful as input to a more robust optimization (Neo) or simulation (Throg) model.
Here's how a greenfield run works:
Step 1: Populate the two required input tables. Triad only needs two input tables to run: Customers and Customer Demand. Both are found in the Model Elements and Demand sections of the Input Tables list in Cosmic Frog's Data module. You can use the technology filter to show only Triad-related tables and fields, simplifying the interface considerably.
Step 2: Configure the Greenfield Settings table. A third table — Greenfield Settings — controls how the run behaves. It's pre-populated with defaults and lives in the Functional Tables section of the input tables. This is where the "Intelligent" in Intelligent Greenfield comes from: the parameters in this table let you fine-tune the analysis without writing code or changing the model structure.
Step 3: Click Run and select the Triad engine. Click the Run button at the top right of the Cosmic Frog application — the same Run button used for Neo (optimization) and Throg (simulation) models. You can run multiple scenarios at once with different inputs in the Customers and Customer Demand tables and different settings in the Greenfield Settings table.
Step 4: Set up scenarios for "what-if" analysis. Beyond changing customer or demand inputs, greenfield scenarios often modify settings on the Greenfield Settings table — for example, capping the maximum number of new facilities. In the Scenarios module, each scenario can include scenario items that target a specific table and field. A scenario named "Max 7 New Facilities," for instance, would change the Max Number Of New Facilities field in the Greenfield Settings table to 7.
Step 5: Use customer clustering to speed up large models. For models with large customer counts, customer clustering reduces solve time by grouping customers within a defined geographic radius into a single representative customer. The clustering radius (in miles) is set in the Customer Cluster Radius column of the Greenfield Settings table. Clustering is optional — leaving the column blank turns it off — and can introduce small losses in optimality, but those are typically manageable since greenfield is used as a starting point for a future Neo optimization run anyway.
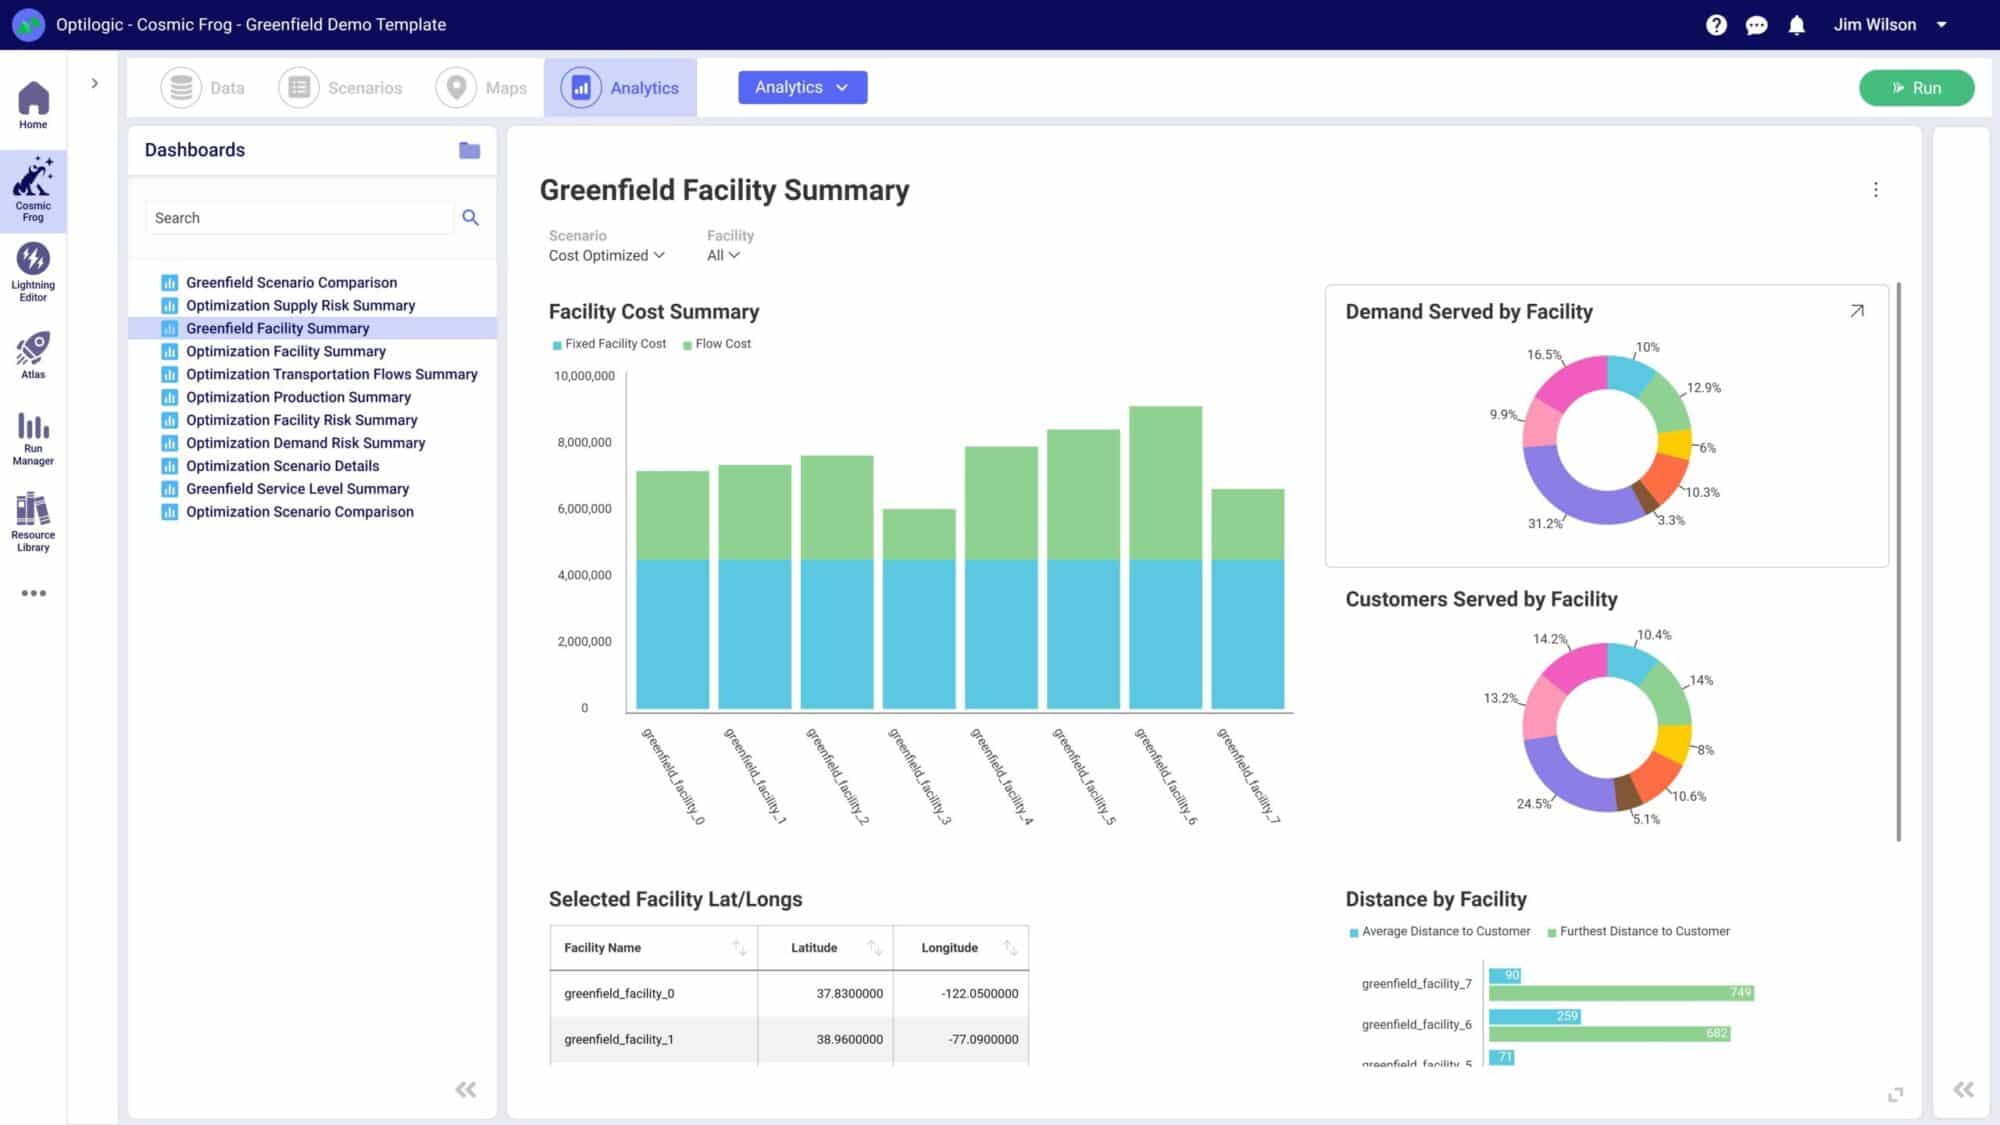
The output is a candidate set of facility locations and customer assignments — ready to feed into a full network optimization model in Cosmic Frog.

Traditional greenfield tools were built as desktop software. Models lived on a single analyst's laptop, were licensed by seat, and required IT involvement to install, patch, and update.
Cosmic Frog runs Intelligent Greenfield Analysis entirely in the cloud:
For teams replacing legacy desktop tools, the cloud delivery model is often the single biggest day-one productivity gain — and it's available the moment you log in.
Ready to speed up your supply chain network design projects with greenfield analysis? Optilogic's cloud-native supply chain design solution, Cosmic Frog, uses advanced optimization algorithms and data analytics to identify the best opportunities for simultaneously reducing transportation costs and distance and boosting supply chain efficiency.
Cosmic Frog can take your most complex supply chain design challenges and produce the most efficient design configuration in a fraction of the time other tools on the market take. This significantly reduces the time to value.
Create a free account to learn how Cosmic Frog gives you the ability to evaluate new designs across cost, service, and risk to select the best designs that improve resilience and shareholder value.
When planning for new facilities or market expansion, reducing transportation expenses and emissions without sacrificing customer service is a tricky problem to solve. The obvious solution is through reducing the distance between you and your customers, but you can't run an unlimited number of distribution centers. Finding the balance between unlimited distribution centers and high transportation costs requires some serious math—how do you narrow down site options before you get into the optimization model? That's where Greenfield analysis software comes in.
Greenfield analysis is commonly used for supply chain site selection, i.e. how many distribution centers (DCs) do I need, where, and what size?
Let's have a look at the basics of greenfield, and how to use Optilogic's intelligent greenfield analysis as a fast and simple, yet powerful way to narrow down facility options to a set of sensible candidates to analyze in a traditional network design model.
Sometimes called center of gravity analysis, greenfield analysis (GFA) is a supply chain network design method that solves the facility location problem.
Intelligent greenfield analysis examines market and industry conditions like your products, demand, and customer locations to determine how many distribution centers you need, where they should be located, and how large they should be to meet a defined service level.
Greenfield is typically a simpler precursor to traditional network design, which models detailed costs, capacities, policies, and constraints. With greenfield analysis, you can start with hundreds of potential location candidates, and by applying parameters, rapidly narrow down to a set of five to 10 for detailed consideration.
To perform greenfield analysis with Optilogic, you'll need only the following data tables:
GFA uses this information to map out the ideal location for production and warehousing facilities and distribution centers.
Greenfield and brownfield analysis answer two different questions about your supply chain network.
Greenfield analysis assumes a clean slate. You're solving for the optimal number, size, and location of facilities based purely on demand, cost, and service goals — without being constrained by what already exists. It's the right approach when you're entering a new market, planning a major expansion, or stress-testing whether your current network is anywhere close to optimal.
Brownfield analysis (BFA) starts with the network you already have. You're evaluating which existing facilities to keep, expand, contract, or close — and where new sites might fit alongside them. It's the right approach when you're rationalizing an inherited footprint, modeling post-acquisition consolidation, or planning incremental change rather than a full redesign. BFA is often used in situations like mergers or when new customers crop up in remote areas.
In Cosmic Frog, you don't have to choose one or the other. Intelligent Greenfield Analysis handles both — you can lock existing facilities as fixed in the model and let the engine recommend additions, or run a true greenfield with no constraints to see what an unconstrained network would look like. Most teams run both side-by-side: greenfield to define the ideal, brownfield to define the achievable, and a network optimization run to bridge the two.
GFA is a simple, fast, and effective way to kick-start a strategic supply chain network design plan. Below are the best reasons to consider implementing GFA into your supply chain network design workflow:
GFA helps manufacturers identify how many distribution centers and factories are necessary to create a smooth and efficient supply chain. The method establishes which customers can be serviced from a specific facility, the best number of facilities for a given supply chain, and the most cost-effective geographic location for each facility.
Because GFA can account for variables like your customer demand and their geographic locations, your budget, and even your customer service goals, the resulting DC placement minimizes transportation costs without sacrificing efficiency or customer satisfaction.
Because GFA identifies the most efficient locations for DCs using the distance between suppliers and customers and the resources available at each location, supply chain operations are more efficient with shorter lead times.
Optimized DC placement ensures locations can serve customers quickly and efficiently, which improves customer service.
Businesses can also use GFA to vet opportunities for expansion and capital expenditures such as new facilities and mergers and acquisitions.
Businesses can use GFA to choose DC locations less susceptible to supply chain disruptions like extreme weather events, political instability, or pandemic-related closures. The method can also be used to explore what-if scenarios for various demand and supply situations. These capabilities make GFA a strong way to secure supply chain resilience throughout ongoing economic volatility and global uncertainty in 2026.
What's the risk rating on your supply chain designs? Optilogic's Cosmic Frog provides a risk rating for every scenario.
Optilogic's Intelligent Greenfield Analysis offers capabilities above and beyond traditional greenfield analysis tools. You can:
Most greenfield tools answer one question: where should facilities go? Cosmic Frog answers several at once.
In a single greenfield run, the engine simultaneously solves for:
And because greenfield output flows directly into Cosmic Frog's network optimization (Neo) and simulation (Throg) engines, candidate locations from a greenfield run can be evaluated alongside:
The reason this matters: separating these decisions across point tools creates blind spots. A site that looks optimal on transportation cost alone may be suboptimal once inventory positioning, service levels, and risk are factored in. Modeling them together in one platform — starting with greenfield and progressing to a full network design — gives you a defensible answer the first time.
In Cosmic Frog, the greenfield engine is called Triad — named after Triadobatrachus, the oldest known frog species. Just as Triadobatrachus is considered the starting point for the evolution of all frogs, Triad serves as a great starting point for modeling projects too. Triad identifies three things in a single run:
Greenfield analysis solves quickly and is designed to be a starting point — its output is most useful as input to a more robust optimization (Neo) or simulation (Throg) model.
Here's how a greenfield run works:
Step 1: Populate the two required input tables. Triad only needs two input tables to run: Customers and Customer Demand. Both are found in the Model Elements and Demand sections of the Input Tables list in Cosmic Frog's Data module. You can use the technology filter to show only Triad-related tables and fields, simplifying the interface considerably.
Step 2: Configure the Greenfield Settings table. A third table — Greenfield Settings — controls how the run behaves. It's pre-populated with defaults and lives in the Functional Tables section of the input tables. This is where the "Intelligent" in Intelligent Greenfield comes from: the parameters in this table let you fine-tune the analysis without writing code or changing the model structure.
Step 3: Click Run and select the Triad engine. Click the Run button at the top right of the Cosmic Frog application — the same Run button used for Neo (optimization) and Throg (simulation) models. You can run multiple scenarios at once with different inputs in the Customers and Customer Demand tables and different settings in the Greenfield Settings table.
Step 4: Set up scenarios for "what-if" analysis. Beyond changing customer or demand inputs, greenfield scenarios often modify settings on the Greenfield Settings table — for example, capping the maximum number of new facilities. In the Scenarios module, each scenario can include scenario items that target a specific table and field. A scenario named "Max 7 New Facilities," for instance, would change the Max Number Of New Facilities field in the Greenfield Settings table to 7.
Step 5: Use customer clustering to speed up large models. For models with large customer counts, customer clustering reduces solve time by grouping customers within a defined geographic radius into a single representative customer. The clustering radius (in miles) is set in the Customer Cluster Radius column of the Greenfield Settings table. Clustering is optional — leaving the column blank turns it off — and can introduce small losses in optimality, but those are typically manageable since greenfield is used as a starting point for a future Neo optimization run anyway.
The output is a candidate set of facility locations and customer assignments — ready to feed into a full network optimization model in Cosmic Frog.
Traditional greenfield tools were built as desktop software. Models lived on a single analyst's laptop, were licensed by seat, and required IT involvement to install, patch, and update.
Cosmic Frog runs Intelligent Greenfield Analysis entirely in the cloud:
For teams replacing legacy desktop tools, the cloud delivery model is often the single biggest day-one productivity gain — and it's available the moment you log in.
Ready to speed up your supply chain network design projects with greenfield analysis? Optilogic's cloud-native supply chain design solution, Cosmic Frog, uses advanced optimization algorithms and data analytics to identify the best opportunities for simultaneously reducing transportation costs and distance and boosting supply chain efficiency.
Cosmic Frog can take your most complex supply chain design challenges and produce the most efficient design configuration in a fraction of the time other tools on the market take. This significantly reduces the time to value.
Create a free account to learn how Cosmic Frog gives you the ability to evaluate new designs across cost, service, and risk to select the best designs that improve resilience and shareholder value.
Fill out the form to unlock the full content
.jpg)


.png)


.png)